Molecular Docking in Computer-Aided Drug Discovery: From Foundational Principles to AI-Driven Advances
This article provides a comprehensive overview of molecular docking methodologies within computer-aided drug design, addressing the needs of researchers, scientists, and drug development professionals.
Molecular Docking in Computer-Aided Drug Discovery: From Foundational Principles to AI-Driven Advances
Abstract
This article provides a comprehensive overview of molecular docking methodologies within computer-aided drug design, addressing the needs of researchers, scientists, and drug development professionals. It explores the foundational principles of ligand-receptor interactions, detailing key search algorithms and scoring functions that drive docking accuracy. The content examines both established and cutting-edge docking software and protocols, including the integration of artificial intelligence and machine learning for enhanced prediction. Practical strategies for troubleshooting common challenges and optimizing docking performance are discussed, alongside rigorous validation frameworks and comparative analyses of methodological approaches. By synthesizing current trends with future directions, this resource serves as a technical reference for implementing molecular docking in modern drug discovery pipelines.
The Essential Guide to Molecular Docking Principles and Ligand-Receptor Interactions
Core Principles and Computational Workflow
Molecular docking is a computational technique that predicts the preferred orientation, or "pose," of a small molecule (ligand) when bound to a macromolecular target (receptor), and estimates the binding affinity of the resulting complex [1] [2]. This method is a cornerstone of Structure-Based Drug Design (SBDD), enabling the virtual screening of chemical libraries, hit identification, and lead optimization by providing atomic-level insights into intermolecular recognition [2] [3].
The underlying computational process involves two main components working in concert: a search algorithm and a scoring function [1] [4]. The search algorithm explores the conformational, rotational, and translational space of the ligand within the defined binding site to generate numerous potential binding poses. Common strategies include systematic methods (e.g., incremental construction), stochastic methods (e.g., genetic algorithms, Monte Carlo), and deterministic methods [1] [2]. Subsequently, the scoring function evaluates and ranks each generated pose by calculating a score that approximates the binding free energy. These functions are broadly categorized as physics-based (using force field terms), empirical (fitting parameters to experimental data), knowledge-based (deriving statistical potentials from structural databases), or consensus (combining multiple scoring methods) [2] [3] [4].
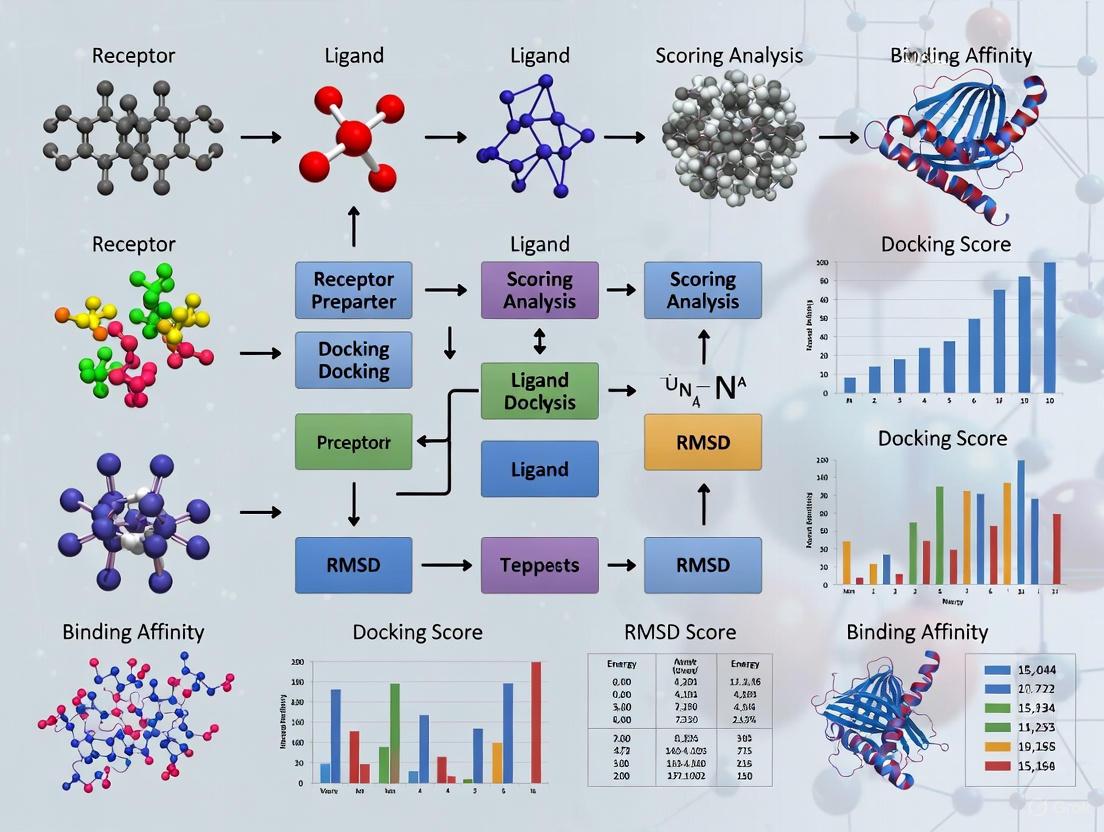
A standard molecular docking workflow, integral to a computer-aided drug discovery (CADD) pipeline, involves several preparatory and analytical steps, as illustrated in the following diagram and detailed in the subsequent protocol.
Diagram 1: Molecular Docking Workflow in CADD (100 chars)
Quantitative Landscape: Software and Performance Metrics
The field offers a diverse array of docking software, each implementing different search algorithms and scoring functions, leading to varying performance profiles [1] [4]. The choice of tool significantly impacts the outcome of a virtual screening campaign or pose prediction task.
Table 1: Classification of Representative Molecular Docking Software [1] [2] [4]
| Software | Primary Search Algorithm | Scoring Function Type | Availability | Key Characteristics |
|---|---|---|---|---|
| AutoDock Vina | Iterated Local Search | Empirical/Knowledge-Based | Free, Open-Source | Speed-optimized, no charge assignment required [1]. |
| GOLD | Genetic Algorithm | Physics-based (GoldScore), Empirical (ChemPLP) | Commercial | Robust handling of ligand flexibility, multiple scoring options [1] [5]. |
| Glide (Schrödinger) | Systematic search + Optimization (XP) | Empirical | Commercial | High accuracy in pose prediction and enrichment, uses hierarchical filters [1] [5]. |
| DOCK | Anchor-and-grow incremental construction | Physics-based/Force Field | Academic License | One of the earliest programs, uses sphere matching for site recognition [1] [5]. |
| FlexX (BioSolveIT) | Fragment-based Incremental Construction | Empirical | Commercial | Efficient handling of ligand flexibility by fragmentation [1] [2]. |
| MolDock/Molegro | Differential Evolution Algorithm | Semiempirical | Commercial | Integrated cavity prediction and high-performance search [1]. |
| Smina | Monte Carlo + Local Optimisation | Empirical (Customisable) | Free, Open-Source | Fork of AutoDock Vina, allows extensive scoring function customization [1]. |
| PLANTS | Ant Colony Optimization | Empirical | Academic License | Uses nature-inspired swarm intelligence for search [1]. |
Performance benchmarking is critical for selecting an appropriate docking tool. Studies typically measure success rate (percentage of ligands docked within a root-mean-square deviation (RMSD) threshold from the experimental pose) and enrichment factor (ability to prioritize active compounds over inactives in virtual screening) [5] [6].
Table 2: Comparative Docking Performance Metrics [5] [6]
| Study Focus & Year | Test Set | Key Performance Comparison (Top-Ranked Pose) | Implication for Method Selection |
|---|---|---|---|
| Program Comparison (2007) | 14 pharmaceutically relevant targets with known actives [5]. | Glide XP showed superior average enrichment. GOLD outperformed DOCK on average. Docking to multiple receptor conformations improved success rates [5]. | No single program dominates all targets. Using multiple protein conformations can mitigate rigid receptor limitations. |
| Hybrid Method Test (2023) | CASF-2016 benchmark set [6]. | CoDock-Ligand (template+CNN scoring): 83.9% success rate (RMSD ≤ 2.0Å). AutoDock Vina: 62.9% success rate (RMSD ≤ 2.0Å) [6]. | Integrating template information from structural databases with modern machine-learning scoring significantly improves pose prediction accuracy. |
Application Notes and Detailed Experimental Protocols
Protocol 1: Integrated Network Pharmacology and Molecular Docking for Natural Product Discovery
This protocol outlines a systematic approach to predict the multi-target mechanisms of natural products or traditional medicine formulations, combining bioinformatics, network analysis, and molecular docking [7] [8].
- Bioactive Compound Screening: Retrieve constituents of the study material (e.g., herbal formula) from databases like TCMSP. Apply absorption, distribution, metabolism, and excretion (ADME) filters (e.g., Oral Bioavailability ≥ 20-30%, Drug-likeness ≥ 0.1-0.18) to identify potentially bioactive compounds [7] [8].
- Target Identification: Obtain predicted protein targets for each screened compound from the database. Standardize target gene names using UniProt. Simultaneously, collect disease-associated targets from GeneCards, OMIM, and DisGeNET [7] [8].
- Network Construction & Analysis: Identify overlapping targets between compound and disease sets. Construct a "Compound-Target-Disease" network using Cytoscape. Perform topology analysis (e.g., "Degree") to identify key compounds and hub targets [7] [8].
- Molecular Docking Validation:
- Preparation: Download 3D structures of hub target proteins from the PDB. Prepare the protein by removing water, adding hydrogen atoms, and assigning charges. Obtain 3D structures of key compounds from PubChem and perform energy minimization [7] [8].
- Execution: Perform molecular docking using tools like CB-Dock or AutoDock Vina. Set the docking search space to either the known binding site or use blind docking if the site is unknown [7] [8].
- Analysis: Evaluate binding poses based on docking score (e.g., Vina score, lower is better), formation of key intermolecular interactions (hydrogen bonds, hydrophobic contacts), and structural complementarity. Prioritize compounds with strong, stable binding to multiple hub targets for further investigation [7] [8].
Protocol 2: Template-Based Docking Enhanced with Machine Learning Scoring
This protocol leverages information from experimentally solved structures in databases to guide docking, improving accuracy for targets with available homologs or ligand-bound templates [6].
- Template Identification and Receptor Preparation: Predict the 3D structure of the target receptor using AlphaFold2 or retrieve an experimental structure. Use a 3D alignment algorithm to search the BioLiP database for homologous protein-ligand complexes. Select high-quality templates (e.g., sequence similarity > 0.8, high-resolution) [6].
- Ligand Conformer Generation and Alignment: Generate an ensemble of 3D conformers for the query ligand from its SMILES string using RDKit. Align the query ligand conformers to the co-crystallized ligand in the selected template using the 3D alignment algorithm to generate initial pose hypotheses [6].
- Pose Refinement and Rescoring: Refine the template-aligned poses using a traditional scoring function for optimization. Subsequently, rescore all poses using a convolutional neural network (CNN)-based scoring function, such as the one implemented in GNINA. The CNN model is trained on diverse protein-ligand complexes and excels at recognizing subtle patterns for binding affinity prediction [6].
- Pose Ranking and Selection: Rank the final poses based on the CNN-derived score. The top-ranked poses are those that not only fit well sterically but also match interaction patterns learned by the model from a vast corpus of structural data [6].
Current Innovations and Future Trajectory
Recent advancements are pushing the boundaries of molecular docking, focusing on improving accuracy, scalability, and utility in drug discovery [3].
- Integration of Machine Learning (ML): ML is revolutionizing scoring functions. Deep learning models, particularly 3D Convolutional Neural Networks (3D-CNNs), are now used to score poses by learning directly from 3D structural data, potentially outperforming classical functions in virtual screening enrichment [3] [6].
- Addressing Target Flexibility: The assumption of a rigid receptor remains a major limitation. Emerging approaches incorporate ensemble docking (docking into multiple receptor conformations) [5] and use normal modes or short molecular dynamics (MD) simulations to sample flexible binding sites, though at higher computational cost [3].
- Synergy of Physics and Knowledge: The integration of physics-based methods (grounded in thermodynamics) with knowledge-based approaches (powered by large-scale data) is a key trend. Hybrid methods that use physical principles for pose generation and data-driven models for scoring are showing promising results [3].
- Focus on Synthesizability and Generalizability: Next-generation docking and virtual screening are increasingly coupled with generative AI models and synthesizability predictors to ensure that top-ranked virtual hits are chemically tractable. Furthermore, rigorous cross-validation strategies are being emphasized to ensure models generalize well to novel target classes [3].
Table 3: Key Research Reagent Solutions and Computational Resources
| Category | Item/Resource | Function & Description | Example/Provider |
|---|---|---|---|
| Structural Databases | Protein Data Bank (PDB) | Primary repository for experimentally determined 3D structures of proteins, nucleic acids, and complexes. Foundation for target preparation [1] [3]. | rcsb.org |
| AlphaFold Protein Structure Database | Repository of highly accurate predicted protein structures for targets lacking experimental data [6]. | alphafold.ebi.ac.uk | |
| Bioactivity & Ligand Databases | ChEMBL | Manually curated database of bioactive molecules with drug-like properties, containing binding affinities and functional assays [3]. | ebi.ac.uk/chembl |
| PubChem | Public database of chemical substances and their biological activities, useful for ligand information and sourcing [1] [3]. | pubchem.ncbi.nlm.nih.gov | |
| ZINC | Freely available database of commercially available compounds for virtual screening, featuring purchasable molecules [1]. | zinc.docking.org | |
| Specialized Databases | PDBbind | Curated database combining 3D structural data from the PDB with binding affinity data, essential for scoring function development and benchmarking [3]. | pdbbind.org.cn |
| BioLiP | A database of biologically relevant protein-ligand interactions, filtered for non-covalent binding, crucial for template-based docking protocols [6]. | zhanggroup.org/BioLiP | |
| Software & Tools | RDKit | Open-source cheminformatics toolkit used for ligand preparation, conformer generation, and molecular descriptor calculation [6]. | rdkit.org |
| AutoDock Tools / MGLTools | Suite of graphical utilities for preparing protein and ligand files, setting up grids, and analyzing results for AutoDock/Vina simulations. | scripps.edu | |
| Cytoscape | Open-source platform for visualizing complex molecular interaction networks and integrating with attribute data [7] [8]. | cytoscape.org | |
| Web Servers | CB-Dock | An online tool for blind molecular docking that automatically predicts binding sites and performs docking [8]. | clab.labshare.cn/cb-dock |
| SwissDock | A web service for easy docking of small molecules to protein targets, based on the EADock DSS algorithm. | swissdock.ch |
Thesis Context: This work forms a core methodological chapter of a broader thesis on Computer-Aided Drug Discovery Molecular Docking Methods Research. It provides the foundational principles, contemporary protocols, and critical evaluation of the computational engines—sampling algorithms and scoring functions—that enable structure-based virtual screening and ligand optimization.
Molecular docking is a pivotal computational technique in structure-based drug design (SBDD), tasked with predicting the optimal binding mode (pose) and the relative binding affinity of a small molecule (ligand) within a target protein's binding site [9]. It operates on the principle of molecular recognition, simulating the physical process by which two molecules associate to form a stable complex [9]. In the context of computer-aided drug discovery (CADD), docking serves as a high-throughput in silico filter, enabling researchers to screen millions of compounds rapidly to identify potential hits, understand structure-activity relationships, and guide lead optimization [9] [10].
The fundamental challenge docking addresses is astronomically complex: exploring the vast conformational, rotational, and translational space of the ligand relative to the protein to find the global energy minimum corresponding to the native bound state [11]. This challenge is tackled through a two-stage process executed by all docking programs: sampling (posing) and scoring [11] [4]. Sampling algorithms generate a multitude of possible ligand poses within the binding site, while scoring functions evaluate and rank these poses based on estimated binding affinity [4]. The accuracy and speed of a docking protocol are directly determined by the sophistication of its sampling algorithm and the predictive power of its scoring function.
Recent years have witnessed a paradigm shift with the introduction of dynamic docking via molecular dynamics (MD) and the disruptive entry of deep learning (DL) models [11] [12]. While traditional "static" docking methods often treat the protein as rigid or semi-flexible for efficiency, these advanced approaches aim to incorporate full flexibility and more accurate physical representations, promising to overcome long-standing limitations [11] [12].
Foundational Physical Principles of Binding
The driving force behind protein-ligand complex formation is the reduction in the system's Gibbs free energy (ΔGbind) [9]. This favorable energy change is governed by the interplay of enthalpy (ΔH, from the formation of attractive interactions) and entropy (ΔS, related to system disorder), as described by the fundamental equation ΔG = ΔH - TΔS [9]. Successful docking must account for the key physicochemical interactions that contribute to ΔGbind.
Table 1: Major Non-Covalent Interactions in Protein-Ligand Binding
| Interaction Type | Strength (kcal/mol) | Physical Basis | Role in Docking |
|---|---|---|---|
| Hydrogen Bonds | ~5 [9] | Electrostatic attraction between H-donor (D-H) and acceptor (A). | Critical for specificity and orientation. Scoring functions parameterize ideal distances and angles [9]. |
| Van der Waals | ~1 [9] | Transient dipole-induced dipole attractions between electron clouds. | Governs shape complementarity ("steric fit"). Modeled by Lennard-Jones potentials in force fields [9]. |
| Hydrophobic Effect | Variable | Entropy-driven aggregation of non-polar groups to minimize ordered water shells. | Major driver of binding. Modeled via surface area or empirical terms [9]. |
| Ionic Interactions | 3-8 (in vacuo) | Electrostatic attraction between fully charged groups. | Strong, distance-dependent contribution. Screened by solvent [9]. |
Molecular recognition is described by three conceptual models [9]:
- Lock-and-Key (Fischer): Rigid complementarity between pre-formed binding surfaces.
- Induced-Fit (Koshland): Ligand binding induces a conformational change in the protein to achieve optimal fit.
- Conformational Selection: The protein exists in an ensemble of states; the ligand selectively binds to and stabilizes a pre-existing compatible conformation.
Most modern docking strategies are built upon the induced-fit or conformational selection models, necessitating algorithms that can account for flexibility [9].
Sampling Algorithms: Exploring Conformational Space
The sampling algorithm's role is to efficiently explore the high-dimensional search space defined by the ligand's and sometimes the receptor's degrees of freedom to generate plausible binding poses [4].
Table 2: Classification and Characteristics of Docking Sampling Algorithms
| Algorithm Class | Key Subtypes | Representative Software | Mechanism | Advantages | Disadvantages |
|---|---|---|---|---|---|
| Systematic | Incremental Construction (Fragmentation) | FlexX [11], DOCK [10] | Ligand is fragmented, core placed, and fragments re-grown in the site. | Deterministic, comprehensive local search. | Can be trapped in local minima; struggles with large, flexible ligands. |
| Conformational Search | Various | Systematically varies torsion angles, rotation, and translation. | Exhaustive in principle. | Computationally intractable for all but the simplest molecules. | |
| Stochastic | Genetic Algorithm (GA) | GOLD [11], AutoDock [11] | Poses ("individuals") evolve via crossover, mutation, selection based on fitness (score). | Effective global search; good for flexible ligands. | Computationally intensive; results can vary between runs. |
| Monte Carlo (MC) | ICM [11], MCDock [4] | Random moves are accepted or rejected based on a Metropolis criterion. | Can escape local minima. | Requires careful tuning of parameters; slow convergence. | |
| Swarm Optimization | - | Particles (poses) move through space influenced by personal and global best. | Efficient parallel exploration. | Less commonly implemented in mainstream packages. | |
| Hybrid & Advanced | Molecular Dynamics (MD) | Dynamic Docking [11] | Simulates physical motion under force field, often with enhanced sampling. | Accounts for full flexibility, solvation, dynamics. | Extremely high computational cost; not for large libraries. |
| Deep Learning (DL) | DiffDock [12], EquiBind [12] | Neural networks (e.g., diffusion models, GNNs) predict poses directly from structure. | Ultra-fast pose generation; learns from data. | Black-box nature; training data bias; can produce physically implausible geometries [12]. |
Protocol 3.1: Standard Procedure for Rigid-Receptor Docking with a Stochastic Algorithm (e.g., AutoDock Vina/GOLD)
- Input Preparation:
- Protein: Obtain the 3D structure (PDB format). Remove water molecules, cofactors, and other heteroatoms. Add polar hydrogens and assign partial charges (e.g., using Gasteiger). Define the binding site (a 3D grid box) centered on a known ligand or catalytic residue [10].
- Ligand: Prepare ligand structure (SDF/MOL2). Generate probable protonation states and tautomers at physiological pH. Minimize energy using a molecular mechanics force field.
- Parameter Configuration:
- Set the search space size (grid box dimensions) to fully encompass the binding pocket with a margin (e.g., 10-15 Å).
- Configure algorithm parameters: For a GA, set population size (e.g., 100), number of generations (e.g., 10,000), crossover/mutation rates, and number of independent runs (e.g., 10-50).
- Select the appropriate scoring function.
- Execution: Launch the docking job. The algorithm will generate and score the specified number of poses.
- Output Analysis: Cluster resulting poses by root-mean-square deviation (RMSD, typically <2.0 Å from native pose is considered successful). Visually inspect top-ranked poses for sensible interactions (H-bonds, hydrophobic packing). Select a diverse set of poses for further analysis [10].
Scoring Functions: Predicting Binding Affinity
Scoring functions are mathematical models used to predict the binding affinity of a given protein-ligand pose [13]. They serve two critical purposes: ranking different poses of the same ligand to identify the most likely binding mode (pose prediction), and ranking different ligands against the same target to identify the strongest binders (virtual screening) [11].
Table 3: Categories of Docking Scoring Functions
| Category | Theoretical Basis | Typical Components | Examples | Pros & Cons |
|---|---|---|---|---|
| Force-Field Based | Classical molecular mechanics. Sum of non-bonded interaction energies. | Van der Waals (Lennard-Jones), Electrostatics (Coulomb). May include implicit solvation terms. | DOCK[3], GoldScore [11], AutoDock [4] | Pros: Strong physical basis. Cons: Neglects entropic contributions; sensitive to partial charges; requires careful parameterization. |
| Empirical | Linear regression fit to experimental binding data (ΔG, Kd). | Weighted sum of "countable" interactions (H-bonds, ionic, hydrophobic contacts, rotatable bond penalty). | ChemScore [4], GlideScore [11], PLP [10] | Pros: Fast, optimized for binding affinity prediction. Cons: Risk of overfitting to training set; may not generalize. |
| Knowledge-Based | Statistical mechanics potentials derived from frequencies of atom-pair interactions in known structures. | Inverse Boltzmann analysis of protein-ligand complex databases to derive potentials of mean force (PMF). | PMF [4], DrugScore [4], IT-Score | Pros: Implicitly captures complex effects; good at pose prediction. Cons: Depends on database quality/coverage; less interpretable. |
| Machine Learning (ML) | Non-linear models trained on complex structural and interaction features. | Features include geometric, energetic, and topological descriptors. Models: RF, SVM, NN, GNN. | RF-Score, NNScore, PIGNet [12], AlphaFold2-inspired | Pros: High predictive power if trained well; can capture complex patterns. Cons: Black box; extensive training data required; poor generalizability if data is biased [13]. |
Protocol 4.1: Evaluating and Selecting a Scoring Function for a Virtual Screen
- Define the Objective: Determine the primary goal: Is it pose prediction (identifying the correct binding geometry) or virtual screening (ranking ligands by affinity)? The best function for each task often differs [14].
- Prepare a Benchmark Set: Assemble a set of protein-ligand complexes relevant to your target (e.g., same protein family). Use databases like PDBbind or CASF [14]. Include both high-affinity binders and non-binders/decoys.
- Perform Re-docking & Cross-docking:
- Re-docking: Dock each native ligand back into its own co-crystallized protein structure. Measure success by the RMSD of the top-ranked pose to the experimental pose (success if RMSD < 2.0Å).
- Cross-docking: Dock ligands into non-cognate protein structures (e.g., apo forms or structures with different ligands). This tests robustness to receptor flexibility [12].
- Calculate Performance Metrics:
- For Pose Prediction: Success Rate (% of complexes with RMSD < 2.0Å).
- For Virtual Screening: Enrichment Factor (EF) at early percent (e.g., EF1% or EF10%), which measures the concentration of true actives in the top-ranked fraction of the screened library [10].
- Apply Consensus Scoring: To improve reliability, use multiple scoring functions and prioritize ligands that are ranked highly by several independent methods [4]. This can reduce false positives arising from the limitations of any single function.
Table 4: Performance Comparison of Select MOE Scoring Functions (Based on CASF-2013 Benchmark) [14]
| Scoring Function (MOE) | Type | Best Docking Score (Affinity Rank) | Best RMSD (Pose Prediction) | Correlation with Exp. Data (pKd/pKi) |
|---|---|---|---|---|
| London dG | Empirical | Moderate | High Performance | Weak |
| Alpha HB | Empirical | Moderate | High Performance | Weak |
| Affinity dG | Empirical | Not Top | Moderate | Weak |
| GBVI/WSA dG | Force-Field | Not Top | Low | Weak |
| ASE | Empirical | Low | Low | Weak |
Note: This pairwise InterCriteria Analysis (ICrA) study found that pose prediction accuracy (Best RMSD) was the most discriminative metric, with London dG and Alpha HB showing the highest comparability and performance [14].
Advanced Methodologies and Emerging Trends
Incorporating Flexibility: From Induced-Fit to Dynamic Docking
Treating the receptor as rigid is a major limitation. Advanced methods address this:
- Ensemble Docking: Docking into an ensemble of multiple pre-generated protein conformations (from MD, NMR, or multiple crystal structures) [11].
- Flexible Side-Chains: Allowing specific side-chains in the binding pocket to rotate during sampling (e.g., in FRED, ICM) [11].
- Dynamic Docking: Using full-atomistic MD simulations with enhanced sampling techniques (e.g., metadynamics, Hamiltonian replica exchange) to simulate the actual binding/unbinding process. This provides kinetic (kon/koff) and thermodynamic (ΔG) data but at a prohibitive computational cost for screening [11].
The Deep Learning Revolution
DL models are transforming docking by learning directly from structural data [12].
- Pose Prediction: Models like DiffDock (diffusion model) and EquiBind (equivariant GNN) predict ligand poses end-to-end in seconds, showing state-of-the-art accuracy on blind docking tasks [12].
- Flexible Docking: Newer models (e.g., FlexPose, DynamicBind) aim to co-predict ligand pose and accompanying protein side-chain or backbone adjustments, tackling the flexibility challenge [12].
- Hybrid Approaches: A promising strategy is using DL for rapid pose generation or binding site identification, followed by refinement with physics-based methods (MD, MM-GBSA) for more accurate scoring [12].
Practical Protocol for Large-Scale Virtual Screening
Protocol 5.1: Best Practices for a Prospective Docking Screen (Adapted from Nature Protocols) [10]
- Pre-Screen Controls (Critical):
- Test Known Actives & Decoys: Dock a set of known binders and non-binders to your target. Calculate the enrichment factor (EF). Optimize docking parameters (box size, sampling exhaustiveness) to maximize EF before the full screen [10].
- Re-docking & Cross-docking Validation: Ensure the pipeline can reproduce known binding poses from crystal structures (re-docking) and is robust to minor receptor variations (cross-docking) [10] [12].
- Library Preparation:
- Distributed Docking Execution:
- Use high-performance computing (HPC) clusters or cloud computing to parallelize jobs.
- Implement a robust job management system to handle millions of docking runs.
- Post-Docking Analysis:
- Apply consensus scoring from multiple functions to prioritize hits [4].
- Cluster top-ranked compounds by chemical structure to select diverse chemotypes for testing.
- Perform visual inspection of the top 100-200 poses to discard poses with unrealistic geometries or interactions.
- Experimental Triangulation: Never rely on docking alone. Plan for orthogonal validation via biochemical assays, crystallography (if possible), or functional cellular assays [10].
Table 5: Key Computational Reagents and Resources for Molecular Docking Research
| Resource Category | Specific Item/Software | Primary Function in Docking Research | Access/Example |
|---|---|---|---|
| Docking Software Suites | AutoDock Vina, GOLD, Glide, MOE, DOCK3.7 | Core engines for performing sampling and scoring calculations. Provide the algorithms and functions. | Vina: Open-source. GOLD/Glide/MOE: Commercial. DOCK: Academic license [11] [10] [4]. |
| Molecular Dynamics Engines | AMBER, GROMACS, NAMD, OpenMM | For advanced dynamic docking, pose refinement, and free energy perturbation (FEP) calculations to improve scoring accuracy. | Open-source (GROMACS, OpenMM) or licensed. |
| Deep Learning Frameworks | PyTorch, TensorFlow, JAX | Building and training custom DL-based docking or scoring models (e.g., graph neural networks). | Open-source. |
| Protein Structure Database | Protein Data Bank (PDB) | Primary source of experimental 3D structures for target preparation and benchmark creation. | www.rcsb.org [9] |
| Binding Affinity Database | PDBbind, BindingDB | Curated datasets of protein-ligand complexes with experimental Kd/Ki values for training and testing scoring functions. | Academic access [14]. |
| Compound Libraries | ZINC, Enamine REAL, MCULE | Large, commercially available, and often synthetically accessible compound libraries for virtual screening. | Free (ZINC) or commercial. |
| Structure Preparation Tools | UCSF Chimera, PyMOL, OpenBabel, RDKit | Visualization, adding hydrogens, assigning charges, format conversion, and ligand conformer generation. | Open-source or commercial. |
| Cheminformatics Toolkits | RDKit, OpenBabel | Scriptable toolkits for ligand standardization, descriptor calculation, and high-throughput workflow automation. | Open-source. |
Molecular docking remains an indispensable, though imperfect, tool in the CADD pipeline. Its effectiveness hinges on a careful balance between the computational expediency of sampling algorithms and the predictive fidelity of scoring functions. While traditional search-and-score methods are mature and optimized for screening ultra-large libraries, they are fundamentally limited by simplified physics and handling of flexibility [11].
The field is evolving along two convergent paths: the physics-based path, exemplified by dynamic docking and free energy calculations, which seeks greater accuracy through more rigorous simulation; and the data-driven path, led by deep learning, which seeks to learn the rules of molecular recognition directly from structural biology data [11] [12]. The future likely lies in sophisticated hybrid approaches that leverage the speed and pattern-recognition power of DL for initial pose generation and screening, coupled with the rigorous, interpretable physics of MD and FEP for lead optimization and affinity prediction [12].
For the practicing researcher, success requires a clear understanding of the underlying assumptions and limitations of each method, rigorous application of control experiments and validation protocols, and, ultimately, the integration of computational predictions with robust experimental biology [10].
Within the broader thesis on computer-aided drug discovery (CADD), molecular docking serves as a cornerstone technique for predicting how a small molecule (ligand) interacts with a biological target at the atomic level [4]. The core computational challenge of docking is the "search problem"—the efficient and accurate exploration of an astronomically large conformational and orientational space to identify the ligand's correct binding pose and affinity [9]. This article frames systematic search methods, specifically conformational search and fragmentation approaches, as critical solutions to this problem. These methodologies are not merely algorithmic choices but represent fundamental strategies for balancing computational tractability with biological realism in structure-based drug design [15].
The efficacy of a drug hinges on specific, complementary interactions with its target protein [9]. Molecular docking algorithms aim to computationally simulate the formation of a stable complex, requiring the exploration of the ligand's translational, rotational, and conformational degrees of freedom within the binding site [4]. Systematic search methods provide a framework for this exploration, either by exhaustively or iteratively sampling the ligand's flexibility (conformational search) or by deconstructing the ligand into simpler units that are easier to place and optimize (fragmentation) [4] [15]. As the field progresses, these classical approaches are being transformed by integration with artificial intelligence (AI) and machine learning, enhancing their precision and scope [16] [17]. This article details the application notes, protocols, and contemporary context of these indispensable methods in modern drug discovery.
Foundations of Systematic Conformational Search in Docking
Systematic conformational search algorithms are designed to methodically explore the potential spatial arrangements of a flexible ligand. The goal is to sample relevant regions of the conformational landscape to identify low-energy poses that are complementary to the protein's binding pocket [15].
Core Algorithmic Strategies
These methods primarily fall into two categories: systematic and stochastic, each with distinct mechanisms for navigating conformational space [4] [15].
- Systematic/Torsional Search: This exhaustive approach rotates all rotatable bonds in the ligand by a fixed increment (e.g., every 10, 15, or 30 degrees), generating all possible combinations of torsion angles. While guaranteeing coverage, its computational cost grows exponentially with the number of rotatable bonds. Pruning algorithms and "bump checks" are employed to eliminate conformations with severe internal or protein-ligand steric clashes, making it feasible within a defined binding site. Docking programs like Glide and FRED utilize variants of this method [15].
- Incremental Construction (Fragmentation-based): This method breaks the ligand into rigid fragments (e.g., ring systems) connected by flexible linkers. A core fragment is first docked, and the molecule is then rebuilt in the binding site by systematically searching for linker conformations that correctly position the remaining fragments. This reduces complexity by focusing the exhaustive search on the flexible linkers rather than the whole molecule. FlexX and certain modes of DOCK are prominent examples [15].
- Stochastic Methods (Monte Carlo, Genetic Algorithms): These algorithms use randomness and probabilistic rules to sample conformational space. Monte Carlo methods make random changes to torsions, accepting or rejecting new poses based on energy criteria and Boltzmann probability [15]. Genetic Algorithms (GA), used by AutoDock and GOLD, encode torsional angles as "genes" and evolve a population of poses over generations through selection, crossover, and mutation, using the docking score as a fitness function [4] [15]. While not exhaustive, they are efficient for exploring high-dimensional spaces.
Table 1: Comparison of Key Conformational Search Algorithms in Molecular Docking.
| Algorithm Type | Search Principle | Key Advantages | Key Limitations | Representative Docking Software |
|---|---|---|---|---|
| Systematic / Torsional Search | Exhaustive rotation of rotatable bonds by fixed increments [15]. | Comprehensive, deterministic coverage of conformational space. | Computationally intractable for very flexible ligands; exponential scaling. | Glide [15], FRED [15] |
| Incremental Construction | Fragments ligand; docks core and rebuilds with systematic linker search [15]. | Reduces search dimensionality; efficient for fragment linking. | Performance depends on correct initial fragmentation and anchor placement. | FlexX [15], DOCK [15] |
| Genetic Algorithm (GA) | Evolves pose population via selection, crossover, mutation [4] [15]. | Efficient for complex, high-dimensional searches; good global exploration. | Can be sensitive to parameter tuning; may require many iterations. | AutoDock [4], GOLD [4] [15] |
| Monte Carlo (MC) | Random moves accepted/rejected based on energy & probability [15]. | Simple, can escape local minima; integrates well with scoring. | May require long runs for convergence; sampling can be inefficient. | MCDOCK [4], ICM [4], Glide (refinement) [15] |
Diagram 1: Generic Workflow for Conformational Search in Docking
The Role of Molecular Dynamics and Ensemble Docking
A significant extension of conformational sampling is the use of Molecular Dynamics (MD) simulations and ensemble docking. Traditional docking often treats the protein as rigid, which is a major limitation given the widespread induced-fit and conformational selection mechanisms of binding [9]. To address this, MD can be used in a pre-docking step to generate an ensemble of receptor conformations, capturing its flexibility and dynamics [15] [18]. Docking ligands against this ensemble—rather than a single static structure—accounts for protein flexibility and can significantly improve virtual screening hit rates and pose prediction accuracy for challenging targets [18].
Fragmentation Approaches: From Retrosynthesis to AI
Fragmentation is a complementary systematic strategy that decomposes a complex molecular search problem into simpler sub-problems. It is central to Fragment-Based Drug Discovery (FBDD) and is increasingly used in AI-driven molecular generation and profiling [19] [20].
Traditional Rule-Based Fragmentation
Traditional methods cleave molecules according to chemically sensible, retrosynthetic rules. They are widely used to create fragment libraries for FBDD or to prepare molecules for docking algorithms like FlexX [19] [17].
- RECAP (Retrosynthetic Combinatorial Analysis Procedure): Cleaves bonds based on 11 chemical rules derived from common synthetic reactions (e.g., amide, ester, ether linkages). It aims to generate synthetically accessible fragments [19] [17].
- BRICS (Breaking of Retrosynthetically Interesting Chemical Substructures): A more granular method using 16 bond cleavage rules defined by environment pairs. It is designed to generate fragments with "dummy atoms" at the breakpoints, facilitating in silico fragment re-linking [19].
- Other Methods: Techniques like Molecular Frameworks (MF), Functional Group (FG) splitting, and Matched Molecular Pair (MMP) analysis serve specific purposes, from identifying core scaffolds to analyzing property changes [19].
Table 2: Characteristics of Selected Molecular Fragmentation Methods [19].
| Method Name | Dimension | Breaks Rings? | Retains Bond Info? | Predefined Library? | Primary Application Tasks |
|---|---|---|---|---|---|
| RECAP | 2D | No | No | No | Interaction Prediction (IP), Molecular Gen. (MG) |
| BRICS | 2D | Yes | No | Yes* | Interaction Prediction (IP) |
| MMPs | 2D | No | Yes | Yes | IP, MG |
| FG Splitting | 2D | No | No | No | IP, Property Prediction (PP) |
| MacFrag | 2D | Yes | Yes | Yes | Not Specified |
| DigFrag (AI) | N/A (Graph-based) | Yes | Implicitly | No | AI-driven Molecular Design |
*BRICS is often used with predefined environments but can be applied generatively.
AI-Driven Digital Fragmentation
A modern paradigm shift is the development of data-driven fragmentation methods using AI, which do not rely on pre-defined chemical rules. DigFrag is a prominent example that uses a Graph Attention Network to learn which bonds in a molecule are most "important" or "cuttable" based on training data (e.g., from bioactivity assays) [17]. It assigns attention weights to bonds and severs those with the lowest weights, effectively performing fragmentation from a machine intelligence perspective rather than a human chemical intuition perspective [17]. This can uncover novel, non-intuitive fragments that expand accessible chemical space for generative models, potentially leading to higher structural diversity in designed compounds [17].
Diagram 2: Fragmentation in the FBDD Workflow
Integration and Application: Protocols and Workflows
The true power of systematic search methods is realized in their integration into coherent, reproducible workflows for lead discovery and optimization.
Protocol: Systematic Conformational Search for Virtual Screening
Objective: To identify potential hit compounds from a large library by predicting their binding pose and affinity against a fixed protein target. Software Examples: AutoDock Vina [4], Glide [15], DOCK [15].
- Target Preparation: Obtain a high-resolution 3D structure of the target protein (PDB). Remove water molecules and co-crystallized ligands. Add missing hydrogen atoms, assign protonation states (e.g., for His, Asp, Glu), and calculate partial charges using tools like PDB2PQR or the software's native preparation suite.
- Binding Site Definition: Define the coordinates of the binding site. This can be based on the known location of a co-crystallized native ligand, a predicted active site, or a grid covering a region of interest.
- Ligand Library Preparation: Prepare the database of small molecules in a suitable format (e.g., SDF, MOL2). Generate 3D coordinates, add hydrogens, and assign charges. For multi-step protocols, generate a set of low-energy conformers for each ligand beforehand.
- Docking Execution:
- Configure the search parameters. For a systematic/torsional search algorithm, this typically involves setting the grid spacing (fineness of search space discretization) and exhaustiveness (number of independent runs or search depth). For a GA, set population size, number of generations, and mutation/crossover rates.
- Submit the batch of ligands for docking. The algorithm will systematically sample each ligand's conformations and orientations within the defined grid, scoring each pose.
- Post-Processing & Analysis: Collect the top-scoring pose(s) for each ligand. Rank the entire library by docking score (estimated binding affinity). Visually inspect the predicted interactions (hydrogen bonds, hydrophobic contacts, pi-stacking) of top-ranked compounds for chemical plausibility. Cluster similar poses to identify consensus binding modes.
Protocol: Fragment-Based Docking and Optimization
Objective: To identify or optimize a lead compound by docking and linking small molecular fragments to a protein target. Software Examples: FlexX [15], Schrödinger's Core Hopping, methods using the BRICS framework [19].
- Fragment Library Curation: Select or generate a fragment library adhering to the "rule of three" (MW ≤ 300, HBD ≤ 3, HBA ≤ 3, cLogP ≤ 3) for good solubility. Libraries can be rule-based (from BRICS), purchased, or AI-generated (from DigFrag) [17] [20].
- Anchor Fragment Docking: Perform high-accuracy docking (often with stricter search parameters) of individual fragments against the target. Identify "anchor" or "base" fragments that make key interactions (e.g., a hydrogen bond to a catalytic residue).
- Fragment Growing or Linking:
- Growing: For a promising anchored fragment, the software systematically searches a database of small chemical substituents or fragments, attempting to covalently attach them at available vectors to improve complementarity and affinity.
- Linking: If two distinct fragments bind in proximal sub-pockets, the software searches a database of linkers to find one that can spatially and conformationally connect them into a single molecule.
- Scoring & Ranking of Composites: The newly formed composite molecules are scored. The scoring function must evaluate not only the interactions of the fragments and linker but also the strain and desolvation penalty introduced by linking.
- Synthetic Assessment & Prioritization: The top-ranked composite structures are filtered for synthetic accessibility (SA score), potential toxicity (structural alerts), and other drug-like properties before being prioritized for synthesis and experimental testing [17].
The Scientist's Toolkit: Key Research Reagent Solutions
Table 3: Essential Software and Resources for Systematic Search Methods.
| Item Name / Resource | Type | Primary Function in Search/Fragmentation | Access / Example |
|---|---|---|---|
| AutoDock Vina | Docking Software | Performs conformational search using a stochastic gradient optimization algorithm; widely used for virtual screening [4]. | Open Source |
| Glide (Schrödinger) | Docking Software | Employs systematic torsional search and Monte Carlo sampling for high-accuracy pose prediction and scoring [15] [16]. | Commercial |
| RDKit | Cheminformatics Toolkit | Provides functions for rule-based molecular fragmentation (e.g., BRICS), conformation generation, and descriptor calculation. | Open Source |
| DigFrag Model | AI Fragmentation Tool | Segments molecules based on learned graph attention weights, generating novel fragments for AI-driven design [17]. | Code Available [17] |
| Fragment Library (ZINC20) | Compound Database | Provides readily available, commercially sourced fragments that adhere to FBDD principles for virtual or experimental screening. | Public Database |
| GOLD | Docking Software | Utilizes a Genetic Algorithm for conformational search and is known for its robust handling of protein flexibility [4] [15]. | Commercial |
| Open Babel / PyMOL | Visualization & Conversion | Essential for preparing, visualizing, and analyzing docking inputs and outputs, including fragment binding poses. | Open Source |
Future Perspectives and Challenges
The evolution of systematic search methods is inextricably linked to advances in computational power and artificial intelligence. The future lies in hybrid models that integrate the physical rigor of traditional sampling with the pattern recognition and predictive power of AI [16].
- AI-Enhanced Search and Scoring: Deep learning models are being used to guide conformational search more efficiently and to develop superior, more generalizable scoring functions that go beyond the limitations of classical force-field or empirical functions [16]. For instance, diffusion models show exceptional pose accuracy but still struggle with physical plausibility, while hybrid AI-physics methods aim for the best balance [16].
- Generalizability and Robustness: A major challenge for AI-driven methods, including fragmentation models like DigFrag, is generalization to novel protein targets or radically different chemotypes not represented in training data [16] [17]. Ensuring these tools are robust and applicable across the diverse landscape of drug discovery remains an active area of research.
- Tackling Protein Flexibility: While ensemble docking is a step forward, true integration of full, on-the-fly protein flexibility during docking remains computationally demanding. Combining rapid conformational search with machine-learned predictions of protein side-chain or backbone movements will be crucial [9] [18].
- From Virtual to Real: A persistent gap exists between in silico predictions and in vitro activity. The integration of systematic search protocols with experimental validation cycles—using biophysical assays (SPR, ITC), structural biology (X-ray, cryo-EM), and medicinal chemistry—is the only path to successful drug discovery [21] [20].
Systematic search methods, through conformational exploration and molecular fragmentation, provide the essential frameworks for solving the fundamental search problem in molecular docking. Within the broader thesis of computer-aided drug discovery, these methodologies represent the engine of structure-based design, enabling the transition from static structural data to dynamic, predictive models of molecular interaction. As the field advances, the convergence of these well-established systematic approaches with cutting-edge artificial intelligence promises to further accelerate the discovery of novel therapeutic agents, making the drug discovery process more efficient, rational, and successful. The ongoing refinement of these protocols and the critical evaluation of their outputs remain paramount for researchers aiming to translate computational predictions into clinical realities.
Within computer-aided drug discovery (CADD), molecular docking is a fundamental structure-based technique for predicting how a small molecule (ligand) interacts with a biological target (receptor) [22]. The core computational challenge lies in efficiently searching the vast conformational and positional space of the ligand within the receptor's binding site to identify the correct binding pose and accurately estimate the binding affinity [4]. Exhaustive search is computationally impossible, necessitating robust sampling algorithms.
Stochastic search algorithms, which introduce controlled randomness into the search process, provide powerful solutions to this problem. Unlike systematic methods, they can navigate complex, multimodal energy landscapes and escape local minima, making them particularly suited for docking flexible ligands [22] [23]. Two predominant stochastic paradigms are the Monte Carlo (MC) method and Genetic Algorithms (GA). This article details their implementations, provides validated protocols for molecular docking within drug discovery research, and compares their performance in practical scenarios.
Monte Carlo Methods for Conformational Sampling
The Monte Carlo method in docking relies on random perturbations of the ligand's state (translation, rotation, torsion angles) followed by an evaluation step to accept or reject the new conformation based on an energy criterion [22]. This approach allows for large conformational jumps, enabling the search to cross energy barriers and explore diverse regions of the binding site.
A landmark implementation is MCDOCK, which employs a non-conventional Monte Carlo simulation for fully flexible ligand docking [24]. Its scoring function combines the ligand-receptor interaction energy with the ligand's internal conformational energy. Validation on 19 protein-ligand complexes demonstrated its ability to converge to experimental binding modes, with root-mean-square deviation (RMSD) values between 0.25 and 1.84 Å [24]. Modern advancements address greater flexibility. The Local Move Monte Carlo (LMMC) approach, for instance, is designed to handle flexible receptor docking by making localized conformational changes, offering a potential solution for modeling backbone flexibility and induced-fit effects [22]. Furthermore, Monte Carlo optimization forms the core of advanced Quantitative Structure-Activity Relationship (QSAR) modeling, where it is used to generate optimal molecular descriptors from SMILES notation, which can be seamlessly integrated with docking studies for lead optimization [25].
Genetic Algorithms for Pose Optimization
Genetic Algorithms are inspired by Darwinian evolution, where a population of ligand poses evolves over generations [22]. Each pose (an individual) is defined by a "chromosome" encoding its spatial coordinates and torsion angles. The population undergoes selection, crossover (mating), and mutation operations, guided by a scoring function that acts as the fitness criterion [4].
The Lamarckian Genetic Algorithm (LGA), implemented in tools like AutoDock, incorporates local minimization into the evolutionary process, allowing individuals to pass on acquired conformational improvements to their offspring [26]. This hybrid strategy significantly enhances convergence. For highly flexible ligands with many rotatable bonds, standard GAs can struggle. Advanced strategies like the Dynamic Modified Restricted Tournament Selection (DMRTS) algorithm have been developed to maintain population diversity and explore multiple high-quality solutions (niching), thereby increasing the success rate in docking and cross-docking challenging molecules like HIV-1 protease inhibitors [23]. Recent research on docking flexible glycosaminoglycans (GAGs) has systematically compared rigid, flexible, and semi-rigid docking (SRD) protocols using a GA-based approach. The SRD protocol, which restricts the flexibility of inter-glycosidic linkages based on known rotamer libraries, proved superior for reproducing native poses, especially for longer oligosaccharide chains [27].
Performance Comparison of Stochastic Docking Algorithms
The performance of MC and GA-based protocols can be evaluated by their accuracy in reproducing experimental poses (success rate) and computational efficiency. The following tables summarize key metrics from foundational and recent studies.
Table 1: Performance Metrics of Monte Carlo Docking (MCDOCK) [24]
| Metric | Result/ Range | Experimental Context |
|---|---|---|
| Docking Accuracy (RMSD) | 0.25 – 1.84 Å | Redocking of 19 small ligand complexes. |
| Success Rate | "Significant percentage" converged | 20 independent runs per complex. |
| Computational Time | <1 min – 15 min per run | Dependent on ligand size/flexibility (SGI Indigo2/R10000). |
Table 2: Performance of Advanced Genetic Algorithm Protocols
| Algorithm/Protocol | Application & Ligand Type | Key Performance Outcome | Source |
|---|---|---|---|
| Semi-Rigid Docking (SRD) with GA | Heparin/HS oligosaccharides (2-10 mer) | Outperformed flexible protocol for pose prediction, especially for 5-10 mers. | [27] |
| DMRTS-GA | Highly flexible HIV-1 protease ligands (12-20 rotatable bonds) | Achieved high success rates in challenging cross-docking scenarios. | [23] |
Detailed Experimental Protocols
Protocol 1: Standard Monte Carlo Docking with a Rigid Receptor This protocol outlines the steps for performing flexible-ligand docking using a Monte Carlo sampling approach, based on the principles of methods like MCDOCK [24].
- System Preparation:
- Obtain the 3D structure of the protein receptor from the PDB. Remove water molecules, cofactors, and other heteroatoms not essential for binding. Add hydrogen atoms and assign partial charges using a molecular mechanics forcefield (e.g., AMBER, CHARMM).
- Prepare the ligand molecule: generate a 3D structure, optimize its geometry, and assign appropriate charges.
- Define the docking search space. If the binding site is known, create a grid box centered on it. For blind docking, the box should encompass the entire protein surface.
- Monte Carlo Simulation Setup:
- Initialization: Randomly place the ligand within the defined search space.
- Perturbation Cycle: For each simulation step (
n_steps, typically 10⁵–10⁷), apply random changes to the ligand's state:- Random translation (Δx, Δy, Δz) within a maximum step size.
- Random rotation (Δα, Δβ, Δγ).
- Random torsion change for each rotatable bond.
- Energy Evaluation: After each perturbation, calculate the total energy of the new pose:
E_total = E_interaction(ligand, receptor) + E_internal(ligand)[24]. - Metropolis Criterion: Decide to accept or reject the new pose. Always accept if
ΔE = E_new - E_old < 0. IfΔE > 0, accept with probabilityP = exp(-ΔE / kT), wherekis the Boltzmann constant andTis the simulation temperature.
- Post-Simulation Analysis:
- Pose Clustering: Cluster all accepted poses from multiple independent runs based on RMSD similarity (e.g., using a 2.0 Å cutoff).
- Ranking & Selection: Rank the lowest-energy member of each cluster by the calculated energy. The lowest-energy poses represent the most probable binding modes.
- Visual Validation: Visually inspect top-ranked poses for key hydrogen bonds, hydrophobic contacts, and other plausible interactions.
Protocol 2: Genetic Algorithm Docking for Flexible Peptides (Semi-Rigid Protocol) This protocol is adapted from recent work on docking flexible biomolecules and is suitable for peptides or glycosaminoglycans [27] [28].
- Structure Preparation & Flexibility Definition:
- Prepare the protein and ligand structures as in Protocol 1.
- For the ligand (e.g., a peptide), define flexibility regimes. Identify rotatable bonds that should be treated as fully flexible (e.g., side-chain torsions) and those that should be semi-rigid (e.g., backbone Φ/Ψ angles of certain residues). For semi-rigid torsions, define a restricted rotational range based on known dihedral libraries (e.g., from the PDB).
- Genetic Algorithm Configuration:
- Population & Encoding: Initialize a population (e.g., 100 individuals). Each chromosome encodes the ligand's position, orientation, and all defined torsional angles.
- Evolutionary Cycle: Run for a set number of generations (e.g., 10,000).
- Fitness Evaluation: Score each pose using an empirical or forcefield-based scoring function.
- Selection: Use a tournament selection method to choose parents for mating based on fitness.
- Crossover: Exchange positional and/or torsional gene segments between two parent chromosomes to create offspring.
- Mutation: Apply random changes to an offspring's genes (position, angle) with a low probability. For semi-rigid torsions, ensure mutations stay within the pre-defined allowed range.
- Niching (Optional): Implement a method like RTS to maintain diversity by using RMSD to compare poses and prevent overcrowding in one region of the search space [23].
- Elitism: Preserve a small percentage of the best individuals unchanged for the next generation.
- Analysis and Validation:
- Pose Extraction & Clustering: Extract the best poses from the final population and multiple GA runs. Cluster them by RMSD.
- Consensus Scoring: Rank clusters using the primary scoring function and, if available, a secondary consensus score or MM/GBSA energy calculation.
- Dynamics Refinement (Optional): Subject the top-ranked pose(s) to a short molecular dynamics simulation in explicit solvent to relax the complex and obtain a more robust affinity estimate [28].
Workflow Visualization
Monte Carlo Docking Iterative Workflow (MC Workflow)
Genetic Algorithm Docking Evolutionary Workflow (GA Workflow)
Table 3: Key Software and Computational Resources
| Resource Name | Type/Function | Relevance to Stochastic Docking |
|---|---|---|
| MCDOCK [24] | Monte Carlo Docking Software | Foundational MC docking program for fully flexible ligands. |
| AutoDock/AutoDock Vina [4] | Docking Suite (LGA & MC) | Widely used open-source tools implementing LGA and MC methods. |
| GOLD [27] | Docking Software (GA) | Commercial software using a GA for docking; used in recent SRD studies. |
| SYBYL/Tripos Force Field [27] | Molecular Modeling Suite | Used for structure preparation, minimization, and parameterization. |
| Protein Data Bank (PDB) | Structural Database | Primary source for experimental receptor and complex structures. |
| GitHub Repository [28] | Code Repository | Source for open, customizable protocols (e.g., for peptide docking). |
| High-Performance Computing (HPC) Cluster | Computational Hardware | Essential for running multiple docking simulations and MD refinement. |
The modern drug discovery pipeline is an extraordinarily resource-intensive endeavor, requiring an average investment of over 10 years and $1.395 billion to bring a single new therapeutic agent to market [29]. Within this high-stakes environment, computer-aided drug design (CADD) has become an indispensable pillar, dramatically increasing the efficiency of the early discovery phases by rationally prioritizing compounds for synthesis and testing [30]. At the heart of structure-based CADD lies molecular docking, a computational technique that predicts how a small molecule (ligand) binds to a target protein and estimates the strength of that interaction [31].
The critical component that translates the structural data from docking into a predictive assessment is the scoring function. Scoring functions are mathematical models that approximate the binding affinity (often as a change in Gibbs free energy, ΔG) between two molecules after they have been docked [32]. They serve three primary, hierarchical goals in a docking campaign: 1) Pose Prediction: Identifying the correct binding geometry from millions of generated poses; 2) Virtual Screening (VS): Classifying active compounds from inactive ones in large libraries; and 3) Binding Affinity Prediction: Accurately ranking compounds by their predicted potency, which is the most challenging task [31]. The development of accurate, fast, and generalizable scoring functions remains one of the most significant challenges in computational chemistry, directly impacting the success rate of discovering new therapeutics [33].
This article details the core architectures of classical scoring functions—Force Field-Based, Empirical, and Knowledge-Based methods—within the context of a broader thesis on molecular docking research. It provides application notes, detailed experimental protocols, and a toolkit for researchers engaged in structure-based drug discovery.
Scoring Function Architectures: Theoretical Foundations and Components
Scoring functions are traditionally classified into three main categories based on their theoretical underpinnings and derivation methodology [31] [32]. Each architecture offers distinct advantages and suffers from specific limitations.
Force Field-Based Scoring Functions
Force field-based functions are grounded in classical molecular mechanics. They estimate binding affinity by summing the non-bonded interaction energies (van der Waals and electrostatic terms) between the protein and ligand atoms, typically using parameters from established force fields like AMBER or OPLS [31] [32].
- Theoretical Basis: The interaction energy is calculated as the sum of pairwise potentials. The van der Waals term is usually modeled with a Lennard-Jones potential, while electrostatics are calculated using Coulomb's law with partial atomic charges. The internal strain energy of the ligand may also be included [32].
- Key Components and Terms:
- Van der Waals Interactions: Models dispersion and repulsion forces.
- Electrostatic Interactions: Calculates interactions between partial charges.
- Solvation Effects: Often incorporated via implicit solvation models (e.g., Generalized Born, Poisson-Boltzmann) to account for desolvation penalties [31] [32].
- Representative Examples: DOCK, DockThor [31]. The Glide docking software also uses the OPLS force field energy as a core component of its scoring funnel [34].
- Advantages and Limitations: These functions have a strong physical basis and are potentially more transferable. However, they are computationally expensive, require careful parameterization, and often struggle with accurately capturing entropic effects and specific interactions like hydrogen bonding without additional terms [33].
Empirical Scoring Functions
Empirical scoring functions are based on the linear regression of experimental binding data against a set of structural descriptors deemed important for binding [31].
- Theoretical Basis: The binding free energy is assumed to be a weighted sum of individual, uncorrelated energy terms. The coefficients for these terms are fitted using multiple linear regression against a training set of protein-ligand complexes with known affinities [31] [32].
- Key Components and Terms: Common descriptors include:
- Representative Examples: LUDI (the first empirical function), ChemScore, GlideScore [31] [34]. GlideScore, for instance, includes a term for "hydrophobic enclosure" which rewards ligands that displace water from tightly packed hydrophobic pockets [34].
- Advantages and Limitations: They are fast to compute and can be highly accurate for systems similar to their training set. Their major drawback is their reliance on the quality and coverage of the training data; they may perform poorly on novel target classes or interaction types not well-represented in the training set [31].
Knowledge-Based Scoring Functions
Knowledge-based, or statistical potential, functions derive interaction potentials from the observed frequencies of atom-pair contacts in large databases of experimentally solved protein-ligand structures [35] [36].
- Theoretical Basis: Applies the inverse Boltzmann law, which states that more frequently observed interatomic distances in crystal structures correspond to more favorable interaction energies. A "potential of mean force" is derived from these statistical distributions, often requiring careful definition of a reference state to account for random, nonspecific associations [35] [36].
- Key Components and Terms:
- Distance-Dependent Pair Potentials: Statistical preferences for pairs of protein and ligand atom types at specific distance bins.
- Reference State: A critical component that models the expected distribution in the absence of specific interactions, accounting for bulk solvent effects [36].
- Representative Examples: DrugScore, PMF (Potential of Mean Force) [31] [35].
- Advantages and Limitations: These functions implicitly capture complex effects like solvation and entropy. They are relatively fast and have good pose discrimination power [35]. Their performance is limited by the size and diversity of the structural database used for derivation, and they can be sensitive to the definition of the reference state [36].
The Emergence of Machine Learning-Based Scoring Functions
A modern extension beyond classical architectures involves machine learning (ML) and deep learning (DL). These are not a separate classical category but a transformative methodology applied across all architectures [33].
- Theoretical Basis: ML/DL-based functions do not assume a predetermined functional form (like a linear sum). Instead, they learn complex, non-linear relationships between structural/energetic features of the protein-ligand complex and its binding affinity directly from large datasets [32] [33].
- Relationship to Classical Functions: They can use descriptors from any classical function (e.g., force field energies, empirical terms, knowledge-based potentials) as input features, or learn directly from raw structural data (e.g., 3D grids, graphs) [33].
- Current Standing: Multiple studies have shown that well-constructed ML/DL scoring functions consistently outperform classical functions in binding affinity prediction and virtual screening enrichment, particularly when sufficient target-specific data is available [32] [33]. However, they risk overfitting and can be "black boxes," offering less intuitive insight than classical functions.
Figure 1: Logical Relationships Between Scoring Function Architectures. Classical architectures derive scores via distinct pathways, while modern Machine Learning methods can unify their outputs as input features for a final, learned prediction.
Comparative Analysis of Scoring Function Performance
The utility of a scoring function is measured against its three core tasks. Performance varies significantly across architectures and specific implementations, as summarized in the tables below.
Table 1: Characteristic Comparison of Classical Scoring Function Architectures
| Characteristic | Force Field-Based | Empirical | Knowledge-Based |
|---|---|---|---|
| Theoretical Basis | Molecular Mechanics (Physics) | Linear Regression (Statistics) | Inverse Boltzmann (Statistics) |
| Primary Data Source | Fundamental physical constants | Training set of complexes with known ΔG | Database of 3D structures (e.g., PDB) |
| Key Energy Terms | vdW, Electrostatics, Solvation | H-bond, Hydrophobic, Entropy penalty | Distance-dependent atom pair potentials |
| Computational Speed | Slow to Medium | Fast | Fast |
| Typical Strength | Pose prediction, Physical insight [31] | Virtual screening enrichment [34] | Pose discrimination [35] |
| Major Limitation | Inaccurate ΔG absolute prediction [31] | Limited transferability [31] | Dependence on database quality [36] |
| Example Software/Tool | DOCK [31], MM/PBSA | GlideScore [34], ChemScore [31] | DrugScore [35], PMF [31] |
Table 2: Performance Metrics of Select Scoring Functions (Illustrative) [33] [34]
| Function (Architecture) | Primary Task Evaluated | Performance Metric | Reported Result | Context / Dataset |
|---|---|---|---|---|
| GlideScore (Empirical) | Virtual Screening Enrichment | Average AUC | 0.80 | DUD dataset (39 targets) [34] |
| GlideScore (Empirical) | Pose Prediction | Success Rate (RMSD < 2.5 Å) | 85% | Astex diverse set [34] |
| DrugScore (Knowledge-Based) | Pose Discrimination | Success Rate (Rank 1 < 2 Å) | ~75% | Test sets of 91 & 68 complexes [35] |
| Classical Methods (Avg.) | Protein-Protein Docking Scoring | Success Rate (Various) | Variable, target-dependent | CAPRI/CCharPPI benchmarks [33] |
| Deep Learning Methods (Avg.) | Protein-Protein Docking Scoring | Success Rate (Various) | Generally superior to classical | CAPRI/CCharPPI benchmarks [33] |
Note: Performance is highly dependent on the specific test set, target, and protocol. The values above are for general comparison.
Detailed Experimental Protocols
The following protocols outline standard methodologies for employing different scoring functions in a virtual screening workflow, from system preparation to analysis.
Protocol for Structure Preparation and Validation (Universal Pre-requisite)
Accurate scoring is contingent on high-quality input structures.
- Source the Protein Structure: Obtain a high-resolution (preferably < 2.5 Å) 3D structure of the target from the PDB, or generate a reliable homology model [32]. For induced fit targets, consider multiple receptor conformations.
- Prepare the Protein with Schrödinger's Protein Preparation Wizard or Similar:
- Add missing hydrogen atoms and side chains.
- Assign protonation states of residues (especially His, Asp, Glu) at the intended pH (e.g., 7.4) using empirical pKa prediction.
- Optimize hydrogen-bonding networks.
- Perform a restrained minimization to relieve steric clashes.
- Define the Binding Site: Define a grid box centered on the known active site or predicted binding region. The box should be large enough to accommodate diverse ligands (typically 20-30 Å per side).
- Prepare the Ligand Library:
- Use a tool like LigPrep to generate 3D structures, enumerate tautomers and stereoisomers, and assign correct ionization states at the target pH.
- Apply drug-like filters (e.g., Lipinski's Rule of Five) to focus on chemically tractable space [29].
- Convert the library into the required format for the docking software.
Protocol A: Virtual Screening using an Empirical Scoring Function (Glide)
This protocol uses Schrödinger's Glide, which employs the empirical GlideScore [34].
- System Setup: Load the prepared protein and ligand library into Maestro.
- Receptor Grid Generation:
- Specify the centroid of the binding site.
- Set the inner (box) and outer (van der Waals scaling) grid dimensions. The outer box defines the space sampled during docking.
- Generate the grid file.
- Ligand Docking (Funnel):
- High-Throughput Virtual Screening (HTVS) Mode: For libraries > 1 million compounds. Fast, reduced sampling. Use to rapidly filter to a manageable subset (e.g., top 10%).
- Standard Precision (SP) Mode: For libraries up to ~500k compounds. The recommended balance of speed and accuracy. Re-dock the top HTVS hits or use as the primary screen for smaller libraries.
- Extra Precision (XP) Mode: For final scoring of top-ranked SP poses (typically < 10k compounds). Uses a more stringent scoring function and sampling to identify poses with precise interactions and favorable hydrophobic enclosure [34].
- Pose Selection and Scoring:
- Glide internally uses the Emodel score (combination of force field energy and GlideScore) to select the best pose for each ligand.
- The final output is ranked by GlideScore (or GlideScore XP).
- Post-Processing:
- Visually inspect the top-ranked poses (e.g., top 50-100) for conserved interactions, sensible binding geometry, and chemical intuition.
- Apply additional filters (e.g., pharmacophore constraints, interaction with a key residue) if needed.
Protocol B: Binding Affinity Refinement using a Force Field-Based Method (MM-GBSA)
MM-GBSA (Molecular Mechanics with Generalized Born and Surface Area solvation) is often used post-docking to improve affinity rankings [32].
- Input Generation: Use the top poses from a docking run (e.g., from Protocol A) as input. Ensure you have the corresponding separated protein and ligand structures for the unbound state.
- Energy Calculations: For each complex, perform the following single-point energy calculations using a molecular dynamics engine (e.g., Desmond, AMBER):
- Energy of the protein-ligand complex (Ecomplex).
- Energy of the protein alone (Eprotein).
- Energy of the ligand alone (E_ligand).
- Free Energy Calculation:
- Apply the MM-GBSA equation: ΔGbind = Ecomplex - (Eprotein + Eligand), where each energy term is: E = Einternal + Eelectrostatic + EvdW + Gsolv.
- The solvation free energy (G_solv) is calculated using a Generalized Born (GB) model for the polar component and a surface area (SA) model for the nonpolar component.
- Analysis: Rank the ligands by their calculated ΔG_bind (more negative values indicate stronger predicted binding). This ranking is often more correlated with experimental affinity than the original docking score but is computationally expensive and typically applied only to hundreds of top hits.
Protocol C: Pose Discrimination using a Knowledge-Based Scoring Function (DrugScore)
Knowledge-based functions excel at identifying near-native poses [35].
- Pose Generation: Use a docking program (e.g., AutoDock Vina, GOLD) to generate multiple candidate poses (e.g., 50-100) for a single ligand.
- Rescoring with DrugScore:
- Extract the structural coordinates for each protein-ligand pose.
- Process each pose with the DrugScore executable or script. DrugScore calculates a score based on the sum of pairwise atom potentials derived from statistical analysis of the PDB [35].
- Ranking and Selection: Rank all generated poses by their DrugScore (higher scores indicate more favorable, native-like geometries). The pose with the highest score is predicted to be the correct binding mode.
- Validation: Compare the top-ranked pose against a known crystal structure (if available) by calculating the root-mean-square deviation (RMSD) of ligand heavy atoms.
Figure 2: Tiered Virtual Screening Workflow Integrating Multiple Scoring Methods. A hierarchical approach that applies faster, lower-accuracy methods to large libraries, followed by more rigorous and expensive methods on progressively smaller subsets.
Table 3: Key Research Reagent Solutions for Scoring Function Development and Application
| Tool/Resource Name | Type/Category | Primary Function in Scoring Context | Key Considerations |
|---|---|---|---|
| Protein Data Bank (PDB) | Structural Database | Source of experimental protein-ligand complexes for training empirical/knowledge-based functions and for benchmark validation [35] [32]. | Data quality (resolution, refinement) varies. Requires careful curation and filtering. |
| Schrödinger Suite (Glide) | Integrated Software | Provides industry-standard empirical (GlideScore) and force field (OPLS) based docking and scoring for virtual screening and pose prediction [34]. | Commercial license required. Protein Preparation Wizard is critical for reliable results. |
| AutoDock Vina | Docking Software | Employs a hybrid scoring function for fast, accessible docking and screening. Often used to generate poses for subsequent rescoring [31]. | Open-source. Good balance of speed and accuracy for initial explorations. |
| AMBER / GROMACS | Molecular Dynamics Engine | Enables MM-PBSA/GBSA calculations for force field-based binding affinity refinement post-docking [32]. | Computationally intensive. Requires expertise in simulation setup and analysis. |
| DUD / DUD-E Dataset | Benchmark Dataset | Provides curated sets of actives and decoys for validating the virtual screening enrichment power of scoring functions [34]. | Standard for evaluating a function's ability to discriminate binders from non-binders. |
| CCharPPI Server | Evaluation Server | Allows for the isolated assessment of scoring function performance on protein-protein complexes, independent of the docking algorithm [33]. | Useful for benchmarking scoring functions on protein-protein interaction targets. |
| AlphaFold2 DB | Predicted Structure DB | Provides high-accuracy predicted protein structures for targets without experimental 3D data, enabling SBDD where previously impossible [30]. | Predicts static structures; may not capture conformational changes relevant for binding. |
| GPU Computing Cluster | Hardware | Essential for running large-scale virtual screening (billions of molecules) and training deep learning-based scoring functions [30] [33]. | Significant capital and operational investment. Cloud-based alternatives are available. |
In computer-aided drug discovery, molecular docking predicts the binding orientation and affinity of a small molecule (ligand) within a target protein's binding site [4]. The accuracy of these predictions hinges on correctly simulating the fundamental physicochemical forces governing molecular recognition. Among these, steric interactions, hydrophobic effects, and hydrogen bonding are primary determinants of binding stability, selectivity, and ultimate biological activity [37]. Steric compatibility ensures shape complementarity, the hydrophobic effect drives the burial of non-polar surfaces, and hydrogen bonds provide directional, specific interactions [38]. This application note details protocols for investigating these key interactions, framed within an integrated computational and experimental workflow essential for robust molecular docking research and lead optimization.
Comparative Analysis of Key Interaction Types
The table below summarizes the defining characteristics, computational handling, and experimental signatures of the three key non-covalent interactions.
Table 1: Characteristics of Key Non-Covalent Interactions in Molecular Recognition
| Interaction Type | Physical Origin & Role | Key Computational Parameters | Primary Experimental Evidence | Typical Energy Contribution |
|---|---|---|---|---|
| Steric (van der Waals) | Shape complementarity; excludes unfavorable atom overlaps. | Van der Waals radii, molecular volume, Verloop parameters (L, B1, B5) [39]. | Structure-activity relationships (SAR); X-ray crystallography showing tight packing. | -0.5 to -1.0 kcal/mol per favorable contact. |
| Hydrophobic | Entropy-driven burial of non-polar surfaces from aqueous solvent. | LogP, solvent-accessible surface area (SASA), hydrophobic contact surface. | Increased binding affinity with non-polar ligand groups; MD simulations of hydration shells [37]. | ~-0.1 kcal/mol per Ų of buried surface. |
| Hydrogen Bonding | Electrostatic attraction between donor (H) and acceptor (lone pair). | Donor-acceptor distance (≈1.5-2.5 Å), angle (≈120-180°), chemical context. | Crystallography; >10-fold potency loss upon removing donor/acceptor; thermodynamic profiling. | -1.5 to -5.0 kcal/mol, depending on burial and environment. |
Steric Interactions: Protocols for QSAR and Docking Analysis
Steric fit is a prerequisite for binding. Quantitative analysis of steric parameters can reveal precise structural constraints for activity and selectivity.
Key Protocol: Correlating Steric Parameters with Biological Activity
This protocol is based on a QSAR study of methcathinone analogues, where steric properties of para-substituents correlated with transporter selectivity [39].
- Compound Series & Data Preparation: Select a congeneric series of ligands. Acquire in vitro potency data (e.g., EC₅₀ or IC₅₀ values for relevant targets).
- Steric Parameter Calculation:
- Calculate substituent volume using molecular modeling software (e.g., SYBYL).
- Calculate Verloop's steric parameters (L, B1, B5) defining length and width [39].
- QSAR Correlation:
- Perform linear regression between log(EC₅₀) and each steric parameter.
- Statistically significant correlations (e.g., p < 0.05) identify the critical steric dimension affecting potency.
- Molecular Docking & Visualization:
- Build a homology model of the target if an experimental structure is unavailable, using a tool like MODELLER [39].
- Dock congeneric ligands using a program like GOLD or AutoDock to generate binding poses [39] [4].
- Visually inspect poses to understand how substituent size/shape alters binding site contacts.
Application Note: Steric Effects on Transporter Selectivity
A study on methcathinone (MCAT) analogues demonstrated that DAT potency decreased with larger 4-position substituent volume (R = -0.803), while SERT potency increased (R = 0.825) [39]. This opposing correlation, driven by differing binding site architectures, translated directly to in vivo effects. Docking into homology models of DAT and SERT provided a structural rationale for these QSAR observations [39].
Table 2: QSAR Correlations for Methcathinone Analogues at DAT and SERT [39]
| Target | Potency Correlation with Substituent Volume (R) | Key Steric Parameter for Selectivity | Implication for Design |
|---|---|---|---|
| DAT (Dopamine Transporter) | -0.803 (Negative) | Maximal width (B5) (R = -0.917) | Smaller, compact substituents favor DAT activity. |
| SERT (Serotonin Transporter) | +0.825 (Positive) | Length (L) (R = +0.903) | Longer, bulkier substituents favor SERT activity and selectivity. |
Hydrophobic Interactions: Assessing Buried Surface and Hydration
Hydrophobic interactions are a major driving force in protein-ligand binding, primarily due to the favorable entropy gain from releasing ordered water molecules from non-polar surfaces [37].
Key Protocol: Analyzing Hydrophobic Interaction in Protein Complexes
This protocol is informed by research on the SARS-CoV-2 spike protein binding to ACE2, where enhanced hydrophobic interaction was a key determinant of high affinity [37].
- System Preparation:
- Obtain high-resolution structures of the protein-protein or protein-ligand complex (e.g., from PDB).
- Prepare the structure by removing irrelevant ligands and adding hydrogens using software like SCIGRESS or Chimera [40].
- Hydration Shell Analysis via MD Simulation:
- Solvate the system in a water box (e.g., TIP3P water model).
- Run a molecular dynamics (MD) simulation (e.g., 50-100 ns) to equilibrate the system.
- Analyze the innermost hydration layer. Calculate the percentage of water molecules that are hydrogen-bonded to the protein surface versus those in a more ordered, "bulk-like" state surrounding hydrophobic patches [37].
- Binding Interface Analysis:
- Calculate the buried solvent-accessible surface area (SASA) upon complex formation.
- Decompose the buried SASA into polar and non-polar components. A high non-polar component indicates a strong hydrophobic driving force.
- Identify specific hydrophobic residues and clusters (e.g., leucine, valine, phenylalanine) at the interface.
Application Note: Hydrophobic Mechanism in SARS-CoV-2 Spike Binding
Despite structural similarity to SARS-CoV, SARS-CoV-2 spike protein binds ACE2 with ~10-fold higher affinity. MD simulations revealed that the receptor-binding domain (RBD) of SARS-CoV-2 has large, interconnected hydrophobic surface areas. Only ~30.6% of water molecules in its innermost hydration shell formed hydrogen bonds with the protein, compared to ~50% expected for a highly hydrophilic surface [37]. This extensive "hydrophobic dewetting" effect at the interface with ACE2, involving hydrophobic portions of hydrophilic side chains, contributes significantly to the enhanced binding affinity through a long-range, entropy-driven mechanism [37].
Hydrogen Bonding: Evaluating Energetic Contributions
Hydrogen bonds provide directionality and specificity. Their contribution to binding affinity is highly context-dependent, especially if they are buried and replace hydrogen bonds to water [41].
Key Protocol: Quantifying H-Bond Contribution via Inhibitor Profiling
This protocol is derived from a study on complement factor D inhibitors, where a single amide group contributed to an 80-fold increase in potency via buried hydrogen bonds [41].
- Design of Matched Molecular Pairs:
- Synthesize or select pairs of nearly identical inhibitors that differ primarily by the presence or absence of a specific hydrogen bonding group (e.g., an amide vs. an ester).
- Experimental Binding Assays:
- Measure inhibitory potency (IC₅₀) using a biochemical enzymatic assay (e.g., with a colorimetric or fluorogenic substrate).
- Determine direct binding affinities (Kd) using a biophysical method like biolayer interferometry (BLI) or surface plasmon resonance (SPR) to obtain kinetic parameters (kon, k_off) [41].
- Structural Analysis:
- Solve co-crystal structures of the target protein in complex with both inhibitors.
- Identify and measure the geometry of hydrogen bonds formed by the key group. Look for interactions with backbone atoms (often more favorable) or side-chain donors/acceptors.
- Computational Validation:
- Perform quantum chemistry calculations on the binding site interaction to understand orbital interactions.
- Run free energy perturbation (FEP) or thermodynamic integration (TI) calculations to computationally estimate the energetic contribution of the specific hydrogen bond.
Application Note: Buried H-Bonds in Factor D Inhibition
For pyrrolidine-based factor D inhibitors, the presence of an amide group (JH1, JH3) versus its absence (JH2, JH4) led to a 80- to 707-fold improvement in binding affinity (Kd from nM to μM range) [41]. Crystal structures revealed the amide formed buried hydrogen bonds with the side chain of Arg217 and backbone atoms of Thr213 and Ser198, interactions not satisfied by water in the apo state. BLI kinetics showed the amide primarily improved the association rate (kon), consistent with the formation of pre-organized, high-affinity interactions [41].
Integrated Experimental-Computational Workflow
A robust drug discovery campaign integrates computational and experimental techniques to validate interaction hypotheses. The following diagram outlines this iterative workflow.
Integrated CADD Workflow for Interaction Analysis
Computational Protocols for Interaction Analysis in Docking
A critical step is the in silico interrogation of docked poses to deconvolute the contributions of different forces.
Key Protocol: Post-Docking Interaction Analysis
This protocol details steps to analyze docking outputs from software like AutoDock Vina, GOLD, or Glide [4] [42].
- Pose Selection & Validation:
- From the docking output, select the top-ranked poses based on the scoring function (e.g., GoldScore, ChemScore) or cluster representatives.
- Validate the pose by calculating the Root Mean Square Deviation (RMSD) from a known co-crystal ligand pose if available. An RMSD < 2.0 Å is generally acceptable [42].
- Interaction Fingerprinting:
- Use software tools (e.g., PoseView, LigPlot+, or MOE) to generate a 2D diagram of all non-covalent interactions.
- Categorize each interaction: hydrogen bonds (distance/angle), hydrophobic contacts (alkyl, pi-alkyl, pi-pi), ionic bonds, and steric clashes.
- Energy Decomposition (if available):
- Some advanced docking or MD programs allow for per-residue or per-interaction energy decomposition.
- Analyze contributions from van der Waals (steric), electrostatic (includes H-bonds), and desolvation (hydrophobic) terms to identify key "hot spot" residues.
- Consensus Scoring & Ranking:
- Re-score the docked poses using multiple scoring functions (e.g., knowledge-based, force-field, empirical) to achieve a consensus on the best pose and estimated affinity [4].
The following diagram summarizes the post-docking analysis pathway.
Post-Docking Interaction Analysis Pathway
The Scientist's Toolkit: Essential Reagents & Software
Table 3: Essential Resources for Interaction-Focused Drug Discovery Research
| Category | Item / Software | Primary Function in Protocol | Example Use Case |
|---|---|---|---|
| Computational Modeling | SYBYL/MOE/Schrodinger | Small molecule & protein preparation, parameter calculation [39]. | Calculating Verloop steric parameters, preparing systems for docking. |
| Homology Modeling | MODELLER, I-TASSER | Building 3D protein models from sequence [39] [40]. | Creating models for targets lacking crystal structures. |
| Molecular Docking | GOLD, AutoDock/Vina, Glide | Predicting ligand binding poses and scoring affinity [39] [4] [42]. | Sampling binding modes for a congeneric series. |
| Molecular Dynamics | AMBER, GROMACS, NAMD | Simulating solvated systems and analyzing dynamics [37]. | Studying hydrophobic dewetting and hydration shells. |
| QSAR & Data Analysis | Prism, SCIGRESS, R/Python | Statistical analysis, linear regression, QSAR modeling [39] [40]. | Correlating steric volume with log(EC₅₀). |
| Experimental Biochemistry | Recombinant Target Protein | Source for binding and inhibition assays [41]. | Measuring K_d and IC₅₀ in enzymatic assays. |
| Biophysical Analysis | Biolayer Interferometry (BLI) System | Label-free measurement of binding kinetics (kon, koff, K_d) [41]. | Quantifying affinity of matched molecular pairs. |
| Structural Biology | Crystallography Suite (e.g., Phenix) | Solving high-resolution co-crystal structures [41]. | Visualizing buried hydrogen bonds and steric packing. |
Advanced Docking Software and Protocol Implementation for Real-World Applications
Molecular docking is an indispensable computational methodology within the paradigm of structure-based drug design (SBDD), a core component of computer-aided drug discovery (CADD). The technique aims to predict the preferred orientation, conformation, and binding affinity of a small molecule (ligand) when bound to a target macromolecule, typically a protein [42] [4]. By simulating this molecular recognition process, docking facilitates the identification and optimization of lead compounds, the prediction of binding modes for known actives, and the virtual screening of extensive chemical libraries to prioritize candidates for costly experimental assays [42] [43]. The overarching goal of a molecular docking program is to accurately reproduce experimental binding poses and reliably rank compounds by their predicted binding affinity [44].
The docking procedure fundamentally comprises two intertwined components: a sampling algorithm and a scoring function [42]. The sampling algorithm explores the conformational, orientational, and positional space of the ligand within the defined binding site to generate plausible binding poses (also called orientations). Common algorithmic approaches include systematic searches, stochastic methods (like Monte Carlo or genetic algorithms), and fragment-based incremental construction [4]. The scoring function then evaluates and ranks each generated pose by estimating the free energy of binding (ΔG). Scoring functions are broadly categorized as force field-based, empirical, knowledge-based, or consensus [4] [45]. The selection of an appropriate docking platform, which integrates a specific algorithm and scoring function, is critical for success, as performance can vary significantly across different protein targets and ligand classes [42].
This analysis provides a detailed comparative evaluation of four widely used molecular docking platforms—AutoDock Vina, GOLD, Glide, and MOE-Dock—framed within the context of advanced research into CADD methodologies. The discussion encompasses their underlying algorithms, scoring functions, performance benchmarks, and provides explicit application protocols to guide researchers in deploying these tools effectively in drug discovery pipelines.
Comparative Platform Analysis: Algorithms, Scoring, and Performance
The selection of a docking platform requires a nuanced understanding of its technical foundations and performance characteristics. The following table provides a structured, quantitative comparison of the four platforms across key parameters, synthesizing data from recent benchmarking studies and software documentation [42] [44] [4].
Table 1: Comparative Analysis of Docking Platforms
| Feature | AutoDock Vina | GOLD (Genetic Optimisation for Ligand Docking) | Glide (Schrödinger) | MOE-Dock (Molecular Operating Environment) |
|---|---|---|---|---|
| Core Algorithm | Iterated Local Search with BFGS gradient-based optimization [44]. | Genetic Algorithm (GA) [4] [43]. | Systematic, hierarchical filters combined with Monte Carlo sampling [4] [43]. | Stochastic search (e.g., Monte Carlo, Tabu) combined with forcefield refinement [43]. |
| Scoring Function Type | Empirical, machine-learning inspired [44] [45]. | Empirical (GoldScore, ChemScore), Knowledge-based (ASP) [43]. | Empirical (GlideScore), with options for MM/GBSA post-processing [43]. | Force Field-based (London dG), Empirical (Affinity dG) [43]. |
| Ligand Flexibility | Full flexibility (rotatable bonds) [44]. | Full flexibility [43]. | Full flexibility [43]. | Full flexibility [43]. |
| Receptor Flexibility | Limited side-chain flexibility [46]. | Full side-chain flexibility [43]. | Induced-fit docking protocols available [43]. | Side-chain and backbone perturbation models [43]. |
| Typical Pose Prediction Accuracy (RMSD < 2 Å) | ~59-82% (varies by target) [42]. | ~59-82% (varies by target) [42]. | ~100% (in benchmark on COX enzymes) [42]. | Data varies; generally high but target-dependent. |
| Virtual Screening Enrichment (AUC Range) | 0.61 – 0.92 [42]. | 0.61 – 0.92 [42]. | 0.61 – 0.92 [42]. | Not specified in benchmarks. |
| Scoring-Power (Pearson Rc vs. Experimental Affinity) | ~0.604 [45]. | 0.416 – 0.617 [45]. | 0.467 – 0.513 [45]. | 0.405 – 0.591 [45]. |
| Speed | Very Fast (orders faster than AutoDock 4) [44] [46]. | Moderate to Slow [43]. | Fast for standard precision, slower for high precision [43]. | Moderate [43]. |
| Typical Search Space Definition | Cubic box; optimal size ~2.9 × ligand's radius of gyration [47]. | Sphere (default radius 15 Å) [47]. | User-defined box or automated site detection [43]. | User-defined box or site from receptor cavity detection. |
| License & Cost | Open-source (Apache License) [46] [43]. | Commercial [43]. | Commercial [43]. | Commercial [43]. |
| Primary Use Case | High-throughput virtual screening, pose prediction [46] [48]. | High-accuracy pose prediction, structure-based design [43]. | High-accuracy pose prediction & lead optimization [42] [43]. | Integrated modeling & simulation within a unified suite [43]. |
AutoDock Vina is a prominent open-source tool known for its exceptional speed, achieved through an efficient Iterated Local Search global optimizer and multi-threading support [44] [46]. Its scoring function combines empirical terms for steric, hydrophobic, and hydrogen-bond interactions, and includes a penalty for ligand rotatable bonds [44]. While its pose accuracy in benchmarks can be lower than Glide's, its speed and no-cost availability make it a default choice for large-scale virtual screening [42] [48].
GOLD utilizes a genetic algorithm for sampling and offers multiple scoring functions (GoldScore, ChemScore, ASP). It is particularly noted for its sophisticated handling of protein flexibility, including full side-chain mobility, which can be crucial for accurate docking when the active site undergoes conformational changes [43].
Glide stands out for its exceptional accuracy in reproducing experimental binding modes, as demonstrated in a benchmark where it achieved 100% success (RMSD < 2Å) for COX-1 and COX-2 inhibitors [42]. It employs a series of hierarchical filters to rapidly search the conformational space, followed by refinement and scoring with the empirical GlideScore function [4] [43]. Its induced-fit docking module is a key feature for modeling reciprocal flexibility.
MOE-Dock is part of a comprehensive commercial software suite. It provides flexibility in choosing search algorithms (e.g., Monte Carlo, Tabu) and scoring functions, including force field-based and empirical options [43]. Its strength lies in integration; docking workflows can be seamlessly combined with MOE's other capabilities for pharmacophore modeling, QSAR, and molecular dynamics.
Detailed Experimental Protocols
Standardized protocols are essential for reproducible and reliable docking results. The following sections detail key experimental methodologies for assessing pose prediction accuracy and virtual screening enrichment.
Protocol for Evaluating Pose Prediction Accuracy
This protocol measures a docking program's ability to reproduce a known experimental binding pose, typically using structures from the Protein Data Bank (PDB).
Dataset Curation:
- Select a non-redundant set of high-resolution protein-ligand complex structures from the PDB. A relevant example is the collection of 51 COX-1 and COX-2 complexes used in recent benchmarks [42].
- Prepare the protein structure by removing water molecules, cofactors, and other heteroatoms not essential for binding. Add missing hydrogen atoms and assign protonation states appropriate for the physiological pH of interest.
- Extract the native ligand from the complex to use as the docking candidate.
System Preparation for Docking:
- For each platform, prepare the receptor and ligand input files according to software specifications (e.g., PDBQT for Vina [44] [46], specific formats for GOLD, Glide, MOE).
- Define the docking search space. Best practice: Center the search box on the centroid of the crystallographic ligand. For AutoDock Vina, set the box dimensions to approximately 2.9 times the radius of gyration (Rg) of the native ligand for optimal accuracy [47]. For other software, follow default recommendations or use a box ensuring at least 10 Å padding around the ligand.
Docking Execution:
- Dock the native ligand back into its original binding site. Use default parameters for exhaustiveness/search effort or set them to a high value (e.g.,
exhaustiveness=32for Vina) to ensure thorough sampling.
- Dock the native ligand back into its original binding site. Use default parameters for exhaustiveness/search effort or set them to a high value (e.g.,
Analysis and Validation:
- Superimpose the top-scoring docked pose onto the crystallographic ligand structure using heavy atoms.
- Calculate the Root Mean Square Deviation (RMSD) between the two structures.
- A docking is typically considered successful if the heavy-atom RMSD is less than 2.0 Å [42]. The success rate across the entire dataset is a key metric of pose prediction reliability.
Protocol for Virtual Screening and Enrichment Assessment
This protocol evaluates a docking program's ability to prioritize active molecules over inactive ones in a database screen.
Preparation of Active and Decoy Sets:
- Compile a set of known active ligands for a specific target.
- Generate a set of property-matched decoy molecules that are presumed inactive. Public databases like the Directory of Useful Decoys, Enhanced (DUD-E) provide such matched decoys [47].
- Combine actives and decoys into a single screening library.
Virtual Screening Run:
- Prepare the protein target and the library of compounds.
- Perform molecular docking of every compound in the library against the prepared target. The search space should be consistently defined (e.g., based on a known active or the binding site).
- Record the docking score for every compound.
Performance Evaluation via ROC Analysis:
- Rank the entire screened library from best (most favorable) to worst (least favorable) docking score.
- Calculate the Receiver Operating Characteristic (ROC) curve by plotting the True Positive Rate (sensitivity) against the False Positive Rate (1-specificity) as the score threshold varies [42].
- Calculate the Area Under the Curve (AUC). An AUC of 0.5 indicates random ranking, while 1.0 indicates perfect separation of actives from decoys. The Enrichment Factor (EF) at a specific threshold (e.g., top 1% of the library) is another critical metric, showing how many times more actives are found compared to random selection [42].
Workflow and Decision Pathway Visualization
The following diagrams illustrate the generalized molecular docking workflow and a logical framework for selecting a docking platform based on research objectives.
Docking Methodology General Workflow
Decision Pathway for Docking Platform Selection
The Scientist's Toolkit: Essential Research Reagents and Materials
Successful docking experiments rely on both software tools and well-curated data resources. The following table lists key "reagent solutions" for the field.
Table 2: Essential Research Toolkit for Molecular Docking
| Tool/Resource Name | Type | Primary Function in Docking Research | Example Source/Reference |
|---|---|---|---|
| Protein Data Bank (PDB) | Database | Primary repository for experimentally determined 3D structures of proteins and nucleic acids, used as sources for receptor preparation and benchmark complexes. | RCSB PDB (rcsb.org) [42] |
| PDBQT File Format | Data Format | The required structure file format for AutoDock/Vina, extending PDB to include atomic partial charges and atom types. | AutoDock Tools [44] [46] |
| Directory of Useful Decoys, Enhanced (DUD-E) | Database | Provides sets of known active molecules and carefully selected property-matched decoys for rigorous virtual screening benchmarking. | dud.docking.org [47] |
| Scoring Function (e.g., GlideScore, GoldScore, Vina) | Computational Method | The mathematical function used to evaluate and rank predicted protein-ligand poses by estimating binding affinity. Core to any docking program. | Software-specific [42] [44] [43] |
| Receiver Operating Characteristic (ROC) Analysis | Analytical Method | Standard statistical method to evaluate the diagnostic ability of a virtual screening run by plotting sensitivity vs. (1-specificity). | Standard library (e.g., scikit-learn) [42] |
| Force Field Parameters (e.g., CHARMM, AMBER) | Parameter Set | Sets of equations and constants for calculating potential energy in molecular systems. Used in force field-based scoring and molecular mechanics refinement. | Parametrized for specific software [4] |
| Crystallographic Ligand | Molecular Structure | The small molecule co-crystallized with the target protein in the PDB. Serves as the "correct answer" for validating pose prediction accuracy. | Extracted from PDB file [42] |
| Radius of Gyration (Rg) | Molecular Descriptor | A measure of a ligand's size and compactness. Used to calculate the optimal docking search space size for AutoDock Vina (Box size ≈ 2.9 * Rg). | Calculated from ligand structure [47] |
Emerging Trends and Future Directions
The field of molecular docking is being transformed by the integration of artificial intelligence and machine learning (ML). While traditional docking relies on hand-crafted scoring functions and search algorithms, next-generation methods use deep learning models to directly predict binding poses and affinities [49] [45]. For instance, DiffDock uses diffusion generative models to achieve state-of-the-art pose prediction accuracy, and FeatureDock employs a transformer-based architecture to predict ligand probability density envelopes, offering improved scoring power for virtual screening [45]. These ML-based approaches show promise in overcoming inherent limitations of classical functions, such as weak correlation with experimental binding affinities (low scoring-power) [45]. Furthermore, the explosion in the size of synthesizable chemical libraries (exceeding billions of compounds) is driving the development of machine learning-accelerated screening, which bypasses explicit docking for ultralarge libraries, and synthon-based approaches that efficiently explore chemical space [49]. The future research landscape will likely involve hybrid workflows, where ultra-fast ML models triage massive libraries, and higher-fidelity traditional or next-gen docking methods provide detailed analysis for a shortlist of promising hits.
The pursuit of novel therapeutics is a defining challenge of modern biomedical science, traditionally characterized by prolonged timelines, substantial costs, and high rates of attrition [16]. Within this landscape, Computer-Aided Drug Discovery (CADD) has emerged as a transformative discipline, providing computational methodologies to streamline the identification and optimization of drug candidates [50]. A cornerstone of CADD is molecular docking, a computational technique that predicts the preferred orientation and binding affinity of a small molecule (ligand) when bound to a target protein [9]. The accuracy of these predictions is foundational to structure-based drug design, virtual screening, and lead optimization [51].
Traditional docking paradigms, however, are fundamentally limited. Most methods treat the protein receptor as a static, rigid structure, accommodating only limited ligand flexibility [52]. This "lock-and-key" approximation fails to capture the intrinsic dynamics and plasticity of proteins, which undergo conformational changes—sometimes substantial—upon ligand binding (an "induced-fit" or "conformal selection" mechanism) [9]. While molecular dynamics (MD) simulations can model this flexibility, they are computationally prohibitive for high-throughput applications due to the rare event sampling problem [52]. Consequently, docking against readily available apo (unbound) or AlphaFold-predicted protein structures often yields poor results, as the binding pocket may be in an inaccessible, closed conformation [52] [16].
This thesis posits that the next paradigm shift in computer-aided drug discovery lies in overcoming the rigidity assumption. The integration of geometric deep learning with principles from generative AI presents a viable path forward. This manuscript details one such groundbreaking approach: DynamicBind, a deep equivariant generative model that performs "dynamic docking." DynamicBind uniquely predicts ligand-specific protein-ligand complex structures from apo-like starting points, explicitly modeling coupled protein-ligand conformational changes [52]. By framing this technology within the broader thesis of advancing CADD methodologies, we explore its architectural innovation, validate its performance against state-of-the-art benchmarks, and provide detailed protocols for its application, thereby illuminating its potential to expand the druggable proteome.
DynamicBind: Architectural Innovation and Core Methodology
DynamicBind is designed to address the critical shortfall of static docking by jointly evolving the conformations of both the ligand and the protein. Its architecture leverages SE(3)-equivariant neural networks, which are inherently designed to respect the rotational and translational symmetries of 3D space, making them ideally suited for structural biology tasks [52].
Model Architecture and Dynamic Docking Process
The model operates through an iterative, diffusion-inspired process. It takes as input an apo protein structure (typically an AlphaFold2 prediction) and a ligand defined by its SMILES string or 3D structure [52].
- Input and Initialization: The ligand is initially placed at a random location and orientation around the protein. Its starting conformation is generated using tools like RDKit [52].
- Iterative SE(3)-Equivariant Processing: Over a series of steps (e.g., 20 iterations), the system state is progressively updated. A central SE(3)-equivariant interaction module processes the geometric and chemical features of the protein-ligand system. Subsequent readout modules predict updates to:
- Ligand pose (translation, rotation, torsion angles).
- Protein backbone and side-chain conformations (translations, rotations of residues, and chi-angle adjustments) [52].
- Staged Refinement: The process often begins with several steps dedicated to refining only the ligand's pose, after which the model simultaneously optimizes both protein and ligand coordinates, allowing for cooperative induced-fit binding [52].
The Morph-Like Transformation: Learning a Funneled Energy Landscape
A key innovation in DynamicBind's training is its departure from standard diffusion training noise. Instead of applying Gaussian noise to native structures, it employs a morph-like transformation to generate training decoys [52].
- Process: Starting from a known holo (ligand-bound) crystal structure, the protein conformation is gradually morphed toward its corresponding apo (or AlphaFold-predicted) conformation. The ligand is removed during this process.
- Advantage: This creates a continuous, physically plausible pathway between biologically relevant meta-stable states (e.g., DFG-in to DFG-out in kinases). The model learns to navigate this smoothed, "funneled" energy landscape, efficiently predicting the reverse transformation—from an apo structure to a ligand-bound state—during inference [52]. This approach is more effective for learning large-scale conformational changes relevant to binding compared to learning from chemically unstable, noise-generated decoys.
Diagram: DynamicBind Dynamic Docking Workflow
Performance Benchmarks and Quantitative Validation
DynamicBind has been rigorously evaluated against traditional and contemporary AI-driven docking methods, demonstrating superior performance in challenging, realistic scenarios where holo structures are unavailable [52] [16].
Pose Prediction Accuracy
Benchmarks on curated test sets like PDBbind and a Major Drug Target (MDT) set show DynamicBind's advanced capability. The MDT set is particularly relevant, containing recent structures from key druggable families: kinases, GPCRs, nuclear receptors, and ion channels [52].
Table 1: Ligand Pose Prediction Success Rates on the MDT Test Set [52]
| Method | Category | RMSD < 2 Å (%) | RMSD < 5 Å (%) | Clash Score < 0.35 & RMSD < 2 Å (%) |
|---|---|---|---|---|
| DynamicBind | Generative Geometric AI | 39 | 68 | 33 |
| DiffDock | Generative Diffusion AI | 32 | 60 | 19 |
| GLIDE SP | Traditional Physics-Based | 25 | 51 | 24 |
| AutoDock Vina | Traditional Physics-Based | 18 | 45 | 17 |
Handling Protein Flexibility and Cryptic Pockets
A defining strength of DynamicBind is its ability to recover large conformational changes. It can accurately induce DFG-out conformations in kinases from DFG-in starting structures, a transition notoriously difficult for MD simulations due to high energy barriers [52]. Furthermore, case studies demonstrate its capacity to identify and open cryptic binding pockets—pockets not present in the apo structure—which are high-value targets for disrupting protein-protein interactions or targeting allosteric sites [52].
Comparative Analysis in a Broader Context
A comprehensive 2025 benchmarking study evaluated multiple docking paradigms across five critical dimensions: pose accuracy, physical plausibility, interaction recovery, virtual screening efficacy, and generalization [16]. The study classified methods into distinct tiers.
Table 2: Multi-Dimensional Benchmarking of Docking Method Paradigms (Adapted from [16])
| Performance Tier | Method Paradigm | Representative Example | Key Strength | Key Limitation |
|---|---|---|---|---|
| Top Tier | Hybrid AI (AI Scoring + Traditional Search) | Interformer | Best balance of high accuracy and physical validity. | Search efficiency can be constrained. |
| High Tier | Traditional Physics-Based | Glide SP, AutoDock Vina | Excellent physical validity and generalization. | Lower pose accuracy for flexible targets. |
| Competitive Tier | Generative Diffusion AI | SurfDock, DiffBindFR, DynamicBind | Superior pose prediction accuracy. | Moderate physical validity; can produce steric clashes. |
| Lower Tier | Regression-Based AI | KarmaDock, QuickBind | Fast inference. | Poor physical plausibility; often invalid poses. |
The study notes that while generative models like DynamicBind achieve top-tier pose accuracy, they can exhibit higher steric tolerance, leading to more physically implausible clashes compared to traditional forcefield-based methods [16]. This highlights an area for continued model refinement.
Diagram: Traditional vs. AI-Enhanced Docking Paradigms
Application Notes and Experimental Protocols
Protocol 1: Standard Dynamic Docking for Pose Prediction
This protocol is used to predict the binding mode of a known active compound against a target of interest.
1. Input Preparation:
- Protein Structure: Obtain the apo structure of your target. AlphaFold2 predictions via databases or local inference are suitable and recommended starting points. Prepare the structure by adding hydrogen atoms, assigning protonation states, and removing crystallographic water molecules, if appropriate. Save in PDB format.
- Ligand Structure: Prepare the ligand molecule. Generate a 3D conformation from its SMILES string using cheminformatics software (e.g., RDKit, Open Babel). Ensure correct protonation and tautomer state. Save in SDF or MOL2 format.
2. Model Configuration & Execution:
- Access the DynamicBind model through its official repository or implemented platform.
- Configure the run parameters:
protein_file: Path to the prepared protein PDB.ligand_file: Path to the ligand file.output_dir: Directory for results.num_steps: Set to 20 (default) for the full refinement cycle.num_predictions: Generate an ensemble (e.g., 5-10) to account for stochasticity.
- Execute the docking run. The model will iteratively refine the complex.
3. Output Analysis and Pose Selection:
- The model outputs multiple predicted complex structures in PDB format.
- It also provides a contact-LDDT (cLDDT) score for each prediction, which correlates with pose accuracy [52].
- Selection Criterion: Rank the outputs by the predicted cLDDT score. The pose with the highest cLDDT is typically the most reliable.
- Validation: Visually inspect the top-ranked pose in molecular visualization software (e.g., PyMOL, ChimeraX). Check for key, known interactions (H-bonds, hydrophobic contacts) and overall physical plausibility.
Protocol 2: Virtual Screening for Lead Identification
This protocol outlines using DynamicBind for screening large compound libraries to identify novel hits.
1. Library and Target Preparation:
- Compound Library: Prepare a database of 3D small molecules in a searchable format (e.g., an SDF file or a dedicated molecular database). This can include commercially available libraries or generated virtual compounds.
- Target Preparation: Follow Step 1 from Protocol 1 to prepare the apo protein structure.
2. High-Throughput Docking Setup:
- Use a workflow manager to parallelize DynamicBind runs across hundreds or thousands of ligands.
- Configure a simplified, faster sampling protocol for screening (may involve reducing
num_steps). The goal is efficiency over ultra-high precision for a single compound. - Critical Step: Implement a cLDDT-based filtering threshold. Based on benchmark studies, set a minimum cLDDT score (e.g., 70) to discard low-confidence poses immediately [52].
3. Post-Screening Analysis & Triaging:
- Primary Hit List: Compile all compounds that produced a pose meeting the cLDDT threshold.
- Interaction Analysis: Analyze the binding modes of the primary hits. Cluster hits by binding pose and scaffold.
- Secondary Scoring: Apply more stringent physical scoring functions (e.g., MM-GBSA) or pharmacophore filters to the top clusters to prioritize a shortlist for experimental testing.
- The final output is a ranked list of chemically diverse, high-confidence hit compounds with predicted binding modes.
Table 3: Key Computational Tools and Resources for AI-Driven Dynamic Docking
| Item / Resource | Category | Function & Relevance | Example / Source |
|---|---|---|---|
| AlphaFold2/3 | Protein Structure Prediction | Generates high-accuracy apo protein structures for targets lacking experimental coordinates, serving as the primary input for DynamicBind. | AlphaFold Protein Structure Database; ColabFold. |
| RDKit | Cheminformatics Toolkit | Used for ligand preparation: converting SMILES to 3D conformations, adding hydrogens, generating tautomers, and calculating molecular descriptors. | Open-source cheminformatics library. |
| SE(3)-Equivariant Network Libraries | Deep Learning Framework | Provides the foundational architectural layers (e.g., tensor field networks) for building models like DynamicBind that respect 3D symmetries. | PyTorch Geometric, e3nn, SE(3)-Transformers. |
| cLDDT Scoring Module | Pose Confidence Estimation | An integral part of DynamicBind that predicts the local distance difference test score for contacts, used to rank and select the most reliable predicted poses. | Implemented within the DynamicBind model. |
| PoseBusters | Validation Suite | A critical toolkit for evaluating the physical and chemical plausibility of docking outputs, checking for steric clashes, bond length validity, and stereochemistry. | Open-source validation toolkit [16]. |
| PDBbind & CASF | Benchmarking Datasets | Curated, high-quality datasets of protein-ligand complexes used to train and fairly benchmark the performance of docking methods like DynamicBind. | Publicly available benchmarks. |
Within the paradigm of computer-aided drug discovery (CADD), molecular docking serves as a pivotal technique for predicting the binding affinity and orientation of a small molecule (ligand) within a target protein's binding site. The reliability of docking simulations is fundamentally contingent upon the quality of the input structural data. This article delineates comprehensive protocols and best practices for preparing molecular structures, focusing on the PDBQT file format and the imperative of chemical standardization. These preparatory steps are not mere pre-processing but are critical to ensuring the accuracy, generalizability, and reproducibility of downstream computational analyses [3].
The PDBQT format (Protein Data Bank, Partial Charge, and Atom Type) is the de facto standard for docking simulations using the AutoDock suite, including AutoDock Vina [53]. It extends the traditional PDB format by incorporating essential information for docking: Gasteiger partial charges and AutoDock atom types. More importantly, it defines a torsion tree for ligands, outlining rotatable bonds and the rigid fragments connected to them, which is essential for the efficient conformational sampling performed by docking algorithms [54]. For receptors, the PDBQT file typically contains only polar hydrogens and assigned charges, treating the protein as a rigid or semi-rigid body.
Concurrently, chemical structure standardization addresses the "garbage in, garbage out" principle in cheminformatics [55]. Public and proprietary compound databases aggregate structures from diverse sources, leading to inconsistencies in representation—such as varying tautomeric forms, aromaticity models, and stereochemistry notations. These inconsistencies can severely impair virtual screening campaigns, quantitative structure-activity relationship (QSAR) modeling, and database retrieval [56]. Standardization is the process of transforming chemical graphs into a consistent, canonical representation according to a defined set of rules, thereby enhancing data integrity and comparability across datasets [55]. In the context of docking, a standardized ligand structure is a prerequisite for correct protonation, charge assignment, and torsion tree definition during PDBQT preparation.
Data Curation and Standardization Protocols
Successful docking studies are built upon high-quality foundational data. The following table summarizes primary public data sources.
Table 1: Key Public Data Sources for Molecular Docking and Modeling
| Data Type | Primary Source | Key Attributes & Metrics | Use in Docking/Modeling |
|---|---|---|---|
| Protein Structures | Protein Data Bank (PDB) [3] | Experimental (X-ray, cryo-EM) coordinates; Resolution; B-factors; Local quality scores (e.g., LIVQ) [3]. | Source of 3D receptor structure. Quality metrics dictate suitability. |
| Ligand Structures | PubChem [56], ChEMBL [3] | 2D/3D compound structures; Linked bioactivity; Standardized identifiers (InChI, SMILES). | Source of small molecule ligands for docking or library building. |
| Curated Complexes | PDBbind [3] | Integrated protein-ligand complexes with binding affinity data (Kd, Ki, IC50). Categorized into General, Refined, and Core sets. | Benchmarking scoring functions; Training knowledge-based models [3]. |
| Bioactivity | ChEMBL [3], BindingDB [3] | >24 million activity records; Standardized pChEMBL values; Assay metadata and confidence scores. | Validating docking hits; Training QSAR models [57]. |
Molecular Standardization: Principles and Operations
Standardization converts diverse molecular representations into a single, consistent form. The process can be conceptualized as a series of checks and transformative remedies [55].
Diagram 1: Workflow for Chemical Structure Standardization (Max Width: 760px).
A robust standardization pipeline involves sequential operations [56] [55]:
- Validity Check: Syntax verification (e.g., correct bond orders, allowed atom valences). Structures failing this check are often rejected.
- Fidelity Check: Consistency with other provided identifiers (e.g., does the structure match its associated InChI?). Discrepancies require resolution.
- Standardization Transformations:
- Aromaticity: Application of a consistent model (e.g., converting aromatic bonds to a canonical Kekulé form) [56].
- Tautomerization: Selection of a canonical tautomeric form based on predefined rules or predicted stability [56]. This is critical as tautomers affect pharmacophore perception and docking.
- Stereo Chemistry: Clarification of ambiguous stereocenters (marked as unknown if information is absent).
- Charge Neutralization: Adjustment of ionization states to a biologically relevant pH (e.g., 7.4), often via protonation/deprotonation of functional groups.
- Fragment Handling: Removal of salts, solvents, and separation of disconnected components.
- Geometry Cleanup: Basic 3D optimization to remove strained conformations.
Table 2: Common Molecular Standardization Operations and Their Impact
| Operation Category | Specific Check/Remedy | Purpose & Impact on Docking |
|---|---|---|
| Validity & Fidelity | Correct hypervalent atoms; Match structure to InChI. | Ensures chemically plausible input; prevents propagation of errors [55]. |
| Tautomerism | Enumerate and select a canonical tautomer (e.g., via rule-based scoring) [56]. | Docking scores are highly sensitive to hydrogen bond donor/acceptor patterns. A dominant physiological tautomer must be used. |
| Aromaticity | Apply a consistent aromaticity model (e.g., convert to Kekulé form). | Ensures consistent bond type perception and partial charge calculation during PDBQT preparation. |
| Protonation/Charge | Add/remove hydrogens to model pH 7.4; neutralize zwitterions. | Directly determines the ligand's charge state and electrostatic interactions in the binding site. |
| Stereo Chemistry | Define unspecified stereocenters as unknown; validate possible configurations. | Prevents generation of unrealistic stereoisomers; crucial for shape complementarity. |
| Fragment & Salt | Remove counterions, metals, and solvents; keep the largest covalent component. | Isolates the bioactive molecular entity for docking. |
Protocol 2.1: Standardizing a Ligand Library using RDKit (Python) This protocol outlines steps to standardize a set of ligands in SMILES format prior to 3D conversion and docking.
- Input: A
.smifile containing one SMILES string and identifier per line. - Load Libraries: Use the RDKit cheminformatics toolkit.
- Sanitization & Validation: Parse SMILES with
Chem.MolFromSmiles(), applying sanitization checks (valence, chemistry). Reject molecules that fail. - Normalization: Apply a series of transformation rules (e.g.,
rdMolStandardize.Normalize()). This handles functional group normalization. - Tautomer Canonicalization: Use
rdMolStandardize.TautomerCanonicalizer()to generate the canonical tautomer. - Charge Neutralization: Use
rdMolStandardize.ChargeParent()to get the uncharged parent form, then re-protonate for a specified pH usingrdMolStandardize.Reionizer(). - Stereo Perception: Use
Chem.AssignStereochemistry()to perceive stereochemistry from the structure. Leave unspecified centers as unknown. - Output: Write canonical SMILES using
Chem.MolToSmiles()with an optional isomeric flag. Store in a standardized library file.
PDBQT File Preparation: Detailed Protocols
The preparation of PDBQT files is a two-step process: initial structure curation and standardization (Section 2), followed by format-specific processing detailed here.
Receptor (Macromolecule) Preparation
The goal is to generate a receptor.pdbqt file with added polar hydrogens, partial charges, and assigned atom types.
Protocol 3.1: Preparing a Receptor PDBQT File using AutoDockTools or Meeko
- Source and Clean the PDB File:
- Download the protein structure (e.g.,
1iep.pdbfrom the PDB) [53]. - Remove Heteroatoms: Delete all non-protein residues except essential cofactors or crystallographic waters. This can be done with molecular viewers (e.g., PyMOL) or command-line tools (
grep -v "HETATM"). - Select a Single Chain: If the biological unit is a monomer, retain only one chain to avoid false symmetry [58].
- Download the protein structure (e.g.,
- Add Hydrogens and Charges:
- Using
mk_prepare_receptor.py(Meeko) [53]: The-pflag directs the tool to add polar hydrogens only and compute Gasteiger charges. - Using AutoDockTools (ADT) GUI [58]:
- Load the cleaned PDB file in ADT.
- Edit > Hydrogens > Add > Polar Only.
- Edit > Charges > Add Kollman Charges.
- Grid > Macromolecule > Choose... and select the molecule. Save as
receptor.pdbqt.
- Using
- Define the Binding Site (Grid Box):
- The coordinates (
center_x, center_y, center_z) and dimensions (size_x, size_y, size_z) of the search space must be defined. Use a co-crystallized ligand's centroid or literature data. - In Meeko, specify
--box_centerand--box_sizeduring preparation to generate a configuration file [53]. - In ADT, use Grid > Grid Box to visually position the box.
- The coordinates (
Ligand Preparation
The goal is to generate a ligand.pdbqt file with charges, atom types, and a defined torsion tree.
Protocol 3.2: Preparing a Ligand PDBQT File
- Obtain 3D Ligand Structure:
- Preferred Source: Download 3D structures in SDF or MOL2 format from PubChem or ChEMBL. Avoid PDB format for ligands as it lacks bond order information [53].
- Generate 3D from SMILES: If only a 2D structure is available, use tools like Open Babel or RDKit to generate a 3D conformer, followed by energy minimization.
- Prepare PDBQT with Torsion Tree:
- Using
mk_prepare_ligand.py(Meeko) [53]: This automatically detects rotatable bonds and sets up the torsion tree. - Using AutoDockTools GUI [58]:
- Load the ligand file (e.g.,
.mol2or.pdb). - Ligand > Input > Open.
- Ligand > Torsion Tree > Detect Root. The root is typically the largest rigid fragment.
- Ligand > Torsion Tree > Set Number of Torsions. Choose which rotatable bonds will be active during docking (limit to ≤10 for efficiency). Non-rotatable bonds (e.g., in rings, amide bonds) are set as "non-active".
- Ligand > Output > Save as PDBQT.
- Load the ligand file (e.g.,
- Using
- Critical Pre-processing: Ensure the ligand's protonation state is correct for the target protein's physiological pH. Use tools like
MolscruborOpenBabelto protonate ligands prior to PDBQT conversion [53].
Diagram 2: PDBQT File Preparation Workflow for Docking (Max Width: 760px).
Table 3: Research Reagent Solutions for Structure Preparation and Docking
| Tool / Resource Name | Category | Primary Function in Workflow | Key Features / Notes |
|---|---|---|---|
| RDKit | Cheminformatics Library | Molecular standardization, descriptor calculation, file format conversion. | Open-source, programmable (Python/C++). Essential for building custom standardization pipelines [55]. |
| Open Babel | File Format Converter | Converts between >100 chemical file formats, including PDBQT [59]. | Command-line and GUI. Useful for batch processing and preliminary structure checks. |
| AutoDockTools (ADT) | Docking Preparation GUI | Interactive preparation of PDBQT files for AutoDock/Vina; visualization of results [58]. | Provides user-friendly control over adding hydrogens, charges, and defining torsion trees. |
| Meeko | Docking Preparation Script | Python-based command-line tool for preparing receptor and ligand PDBQT files for Vina [53]. | Enables automation and integration into high-throughput screening pipelines. |
| Molscrub | Ligand Pre-processing | Protonates small molecules at a target pH and generates 3D conformers [53]. | Crucial for ensuring ligands are in the correct ionization state before docking. |
| PyMOL / ChimeraX | Molecular Visualization | Cleaning PDB files, analyzing binding sites, visualizing docked poses and interactions. | Used to remove water, select chains, and define the binding site grid box coordinates. |
| PubChem Standardization Service | Online Standardization | Web-based tool for standardizing chemical structures according to PubChem's rules [56]. | Useful for quick, one-off standardization and validation of structural representations. |
Integration and Best Practices for Reliable Docking
The integration of rigorous structure standardization and meticulous PDBQT preparation forms the bedrock of reliable molecular docking studies. To ensure robustness, adhere to the following synthesized best practices:
- Begin with the Highest Quality Structures: For receptors, prioritize high-resolution crystal structures (<2.0 Å) with low B-factors in the binding site. For ligands, use experimentally determined geometries from co-crystal structures or trusted databases [3].
- Standardize First, Then Prepare: Always apply chemical standardization rules to your ligand library before generating 3D conformations and PDBQT files. This guarantees a uniform, chemically sensible starting point [56] [55].
- Validate Protonation and Tautomer States: Do not rely on default states. Use external tools (
Molscrub,Epik) to predict the predominant state at physiological pH, especially for key functional groups like histidine, carboxylic acids, and guanidines [53]. - Carefully Manage Receptor Flexibility: While standard PDBQT treats the receptor as rigid, consider critical side-chain flexibility through methods like ensemble docking (using multiple receptor conformations) or specifying flexible residues in tools like AutoDockFR.
- Define an Appropriate Search Space: The grid box should be large enough to accommodate ligand movement but focused enough to make the search computationally efficient. Center it on known active site residues or a co-crystallized ligand.
- Document All Parameters: Maintain a detailed log of all preparation steps: software versions, command-line arguments, charge models, active torsions, and grid box coordinates. This is essential for reproducibility [60].
- Benchmark Your Pipeline: Test your entire preparation and docking pipeline on a set of known protein-ligand complexes from a benchmark like PDBbind Core Set [3]. The ability to reproduce the native pose (low RMSD) validates your protocols.
By embedding these standardized preparation protocols into the molecular docking workflow, researchers can significantly enhance the accuracy and interpretability of their computational predictions, thereby making more informed decisions in the structure-based drug discovery pipeline.
Computer-Aided Drug Design (CADD) is an established computational framework that accelerates and optimizes drug discovery by simulating drug-target interactions. Within this framework, virtual screening (VS) has emerged as a core, high-throughput technology for lead identification [61]. VS computationally filters extensive compound libraries—containing millions to billions of molecules—to prioritize a manageable subset of candidates with the highest probability of exhibiting desired biological activity against a chosen target. This process significantly reduces the cost, time, and resource burden associated with experimental high-throughput screening (HTS) alone [62] [63].
The integration of VS is particularly transformative for addressing complex diseases, such as oral diseases (e.g., dental caries, periodontitis, oral cancer), where traditional screening methods face challenges due to complex disease mechanisms and specific local delivery requirements [62] [63]. By leveraging methods like molecular docking, pharmacophore modeling, and machine learning, VS enables the rapid identification of novel scaffolds for antibacterial, anti-inflammatory, and anticancer therapies, showcasing its direct application in overcoming modern drug discovery hurdles [63].
This article provides detailed application notes and experimental protocols for implementing high-throughput virtual screening (HTVS). The content is framed within a broader thesis on molecular docking methods, offering researchers a practical guide to deploy these protocols effectively within an integrated CADD workflow for lead discovery.
Methodology: Virtual Screening Approaches & Workflows
Virtual screening strategies are broadly categorized by the type of primary information available: the three-dimensional structure of the biological target or the chemical structures of known active ligands. The choice of method dictates the subsequent workflow and computational tools.
Structure-Based Virtual Screening (SBVS)
SBVS requires a 3D structure of the target protein, obtained from X-ray crystallography, NMR, Cryo-EM, or computational prediction tools like AlphaFold or RaptorX [62] [63]. The core technique is molecular docking, which predicts how a small molecule (ligand) binds within a target's binding site and scores the affinity of that interaction.
A standard SBVS workflow involves:
- Target Preparation: Refining the protein structure (adding hydrogens, assigning charges, optimizing side-chain conformations).
- Binding Site Definition: Identifying the key cavity or region where ligand binding modulates biological function.
- Ligand Library Preparation: Converting compound libraries into 3D formats, enumerating tautomers and protonation states at biological pH.
- Molecular Docking: Executing docking simulations for each ligand against the target.
- Post-Docking Analysis: Ranking compounds based on docking scores and analyzing binding poses for key interactions (e.g., hydrogen bonds, hydrophobic contacts).
Ligand-Based Virtual Screening (LBVS)
LBVS is employed when the target structure is unknown but a set of known active compounds is available. It operates on the principle that structurally similar molecules are likely to have similar biological activities.
Core LBVS methods include:
- Pharmacophore Modeling: Identifies and maps the essential steric and electronic features (e.g., hydrogen bond donor/acceptor, aromatic ring, hydrophobic region) necessary for biological activity. Screening involves searching for compounds that match this 3D feature arrangement [62].
- Quantitative Structure-Activity Relationship (QSAR): Builds a mathematical model correlating calculated molecular descriptors (e.g., lipophilicity, polar surface area) of known actives with their biological activity. This model then predicts the activity of new compounds [63].
- Similarity Searching: Uses molecular "fingerprints" (bit-string representations of chemical structure) to compute the similarity between candidate molecules and known actives.
Integrated & AI-Enhanced Screening
Modern HTVS increasingly adopts hybrid or consensus approaches that combine SBVS and LBVS to improve prediction accuracy and robustness [62] [63]. Furthermore, Artificial Intelligence (AI) and Machine Learning (ML) are now deeply embedded within these workflows, representing the advanced subset of AI-driven drug discovery (AIDD) within CADD [63]. AI/ML models are used for pre-screening library filtering, improving scoring functions, generating novel drug-like molecules, and predicting ADMET (Absorption, Distribution, Metabolism, Excretion, Toxicity) properties early in the screening cascade.
The following workflow diagram integrates these concepts into a cohesive HTVS protocol.
Diagram: High-Throughput Virtual Screening (HTVS) Integrated Workflow. This diagram illustrates the sequential and parallel stages of an integrated HTVS protocol, from library and target input to experimental validation, highlighting the convergence of ligand-based and structure-based methods enhanced by AI/ML.
Application Notes & Experimental Protocols
Protocol 1: Structure-Based Virtual Screening via Molecular Docking
Objective: To identify novel inhibitors against a target protein (e.g., a kinase involved in oral cancer signaling) from a large commercial library.
Materials & Software:
- Target Protein: PDB structure (e.g., 7LGF) or AlphaFold-predicted model [63].
- Compound Library: ZINC20 database subset (e.g., "drug-like" subset, ~10 million compounds).
- Docking Software: AutoDock Vina, GLIDE (Schrödinger), or GOLD.
- Preparation Tools: UCSF Chimera or Maestro (for protein preparation); Open Babel or LigPrep (for ligand preparation).
- Computing Resources: High-performance computing (HPC) cluster with multi-core nodes.
Step-by-Step Methodology:
Target Preparation:
- Load the protein PDB file into UCSF Chimera.
- Remove water molecules and heteroatoms not part of the binding site.
- Add missing hydrogen atoms and assign standard protonation states at pH 7.4.
- Calculate and assign partial charges using the AMBERff14SB force field.
- Define the binding site by selecting residues within a 10 Å radius of the native co-crystallized ligand.
- Save the prepared structure in PDBQT format (for Vina) or as a grid file.
Ligand Library Preparation:
- Download the SDF file of the compound library subset.
- Use Open Babel to: a) Convert format to PDBQT; b) Generate possible tautomers and protonation states at pH 7.4 ± 2.0; c) Perform energy minimization using the MMFF94 force field.
- Log the number of resultant distinct molecular conformations for tracking.
Molecular Docking Execution:
- Configure the docking search space using coordinates from the defined binding site center (
center_x, center_y, center_z) and a box size sufficient to encompass it (size_x=25, size_y=25, size_z=25Å). - For high-throughput execution on an HPC cluster, use a job array script to parallelize docking across thousands of CPU cores. Example Slurm script for AutoDock Vina:
- Set exhaustiveness to a minimum of 20 to ensure adequate search depth.
- Configure the docking search space using coordinates from the defined binding site center (
Post-Docking Analysis & Hit Prioritization:
- Extract docking scores (binding affinity in kcal/mol) from all output log files.
- Rank all compounds by score and select the top 0.1% (e.g., ~10,000 from 10 million).
- Cluster these top-scoring compounds by molecular similarity (Tanimoto coefficient >0.7) to ensure chemical diversity.
- Visually inspect the top-ranked pose from each cluster in the binding site using PyMOL or Chimera. Prioritize compounds that form key interactions (e.g., hydrogen bonds with catalytic residues, optimal hydrophobic packing).
- Output a final prioritized list of 100-200 compounds for subsequent in silico validation (Protocol 3).
Protocol 2: Ligand-Based Virtual Screening Using Pharmacophore Modeling
Objective: To discover novel antimicrobial agents against Porphyromonas gingivalis by screening for compounds matching the essential features of a known active peptide [63].
Materials & Software:
- Known Active Ligands: Set of 3-5 peptide structures with confirmed anti-P. gingivalis activity (IC₅₀ < 50 µM).
- Screening Database: Natural product library (e.g., UNC Natural Product Library, ~50,000 compounds).
- Software: PharmaGist (online) or Phase (Schrödinger) for pharmacophore generation; ZINCPharmer or Unity (Tripos) for screening.
Step-by-Step Methodology:
Pharmacophore Model Generation:
- Align the 3D conformations of the known active peptides using flexible alignment in software like Phase.
- Analyze the common interaction features: Identify hydrogen bond acceptors (A), hydrogen bond donors (D), hydrophobic regions (H), and positively charged groups (P) present across all actives.
- Generate a common feature pharmacophore hypothesis containing 4-5 essential features (e.g., A1, D2, H3, P4).
- Validate the model's selectivity by screening a small set of known active and inactive compounds; ensure it retrieves actives (sensitivity) and rejects inactives (specificity).
Database Screening:
- Prepare the screening database by generating multiple conformers for each compound (e.g., up to 250 per molecule).
- Use the screening tool (e.g., ZINCPharmer) to search for compounds that spatially fit all (or a user-defined subset) of the pharmacophore features.
- Apply geometric constraints (e.g., distances between features) with a tolerance of ±1.5 Å.
- Execute the screen and retrieve all hits that match the query.
Hit Refinement & Scoring:
- Score the matched hits based on the RMSD of their alignment to the pharmacophore and the number of matched features.
- Filter hits by drug-likeness using calculated properties (e.g., molecular weight < 500, LogP < 5).
- Perform a similarity check against the original training actives to flag potential scaffolds versus novel chemotypes.
- Generate a shortlist of 200-500 compounds for subsequent molecular docking (Protocol 1) against a relevant bacterial target structure to validate the binding mode.
Protocol 3: Post-Screening Validation & Triaging
Objective: To triage virtual hits through computational filters for drug-likeness, toxicity, and synthetic accessibility before experimental testing.
Materials & Software:
- Hit List: Output from Protocols 1 and/or 2.
- Software: SwissADME or admetSAR (web servers) for property prediction; SwissSidechain or SyGMa for metabolite prediction; RDKit (Python) for synthetic accessibility scoring.
Step-by-Step Methodology:
ADMET Property Prediction:
- Upload the hit list (SDF format) to the SwissADME web server.
- Analyze key predicted parameters:
- Lipinski's Rule of Five: Flag any compound with >1 violation.
- Pharmacokinetics: Assess predicted Caco-2 permeability (for oral absorption), P-glycoprotein substrate status, and CYP450 inhibition profile.
- Solubility: Check the consensus Log S value (ideally > -6).
- Medicinal Chemistry Friendliness: Review PAINS (Pan Assay Interference Compounds) alerts; remove any compounds with high-risk structural motifs.
Toxicity & Synthetic Accessibility Assessment:
- Use the admetSAR server to predict endpoints like hERG cardiotoxicity (risk if pIC₅₀ > 5) and Ames mutagenicity.
- Employ the RDKit library to calculate the Synthetic Accessibility (SA) Score. Compounds with an SA Score > 6 may be difficult to synthesize and should be deprioritized unless exceptionally promising.
- For peptide hits, predict susceptibility to proteolytic cleavage using tools like SwissSidechain.
Consensus Ranking & Final Selection:
- Create a weighted scoring system. Example:
- Docking Score (Vina, kcal/mol): 40% weight.
- Pharmacophore Fit Score (RMSD): 20% weight.
- Synthetic Accessibility Score: 20% weight.
- Number of ADMET warnings: 20% weight (negative score).
- Calculate a composite score for each hit and re-rank the entire list.
- Visually inspect the top 50-100 compounds. Select 20-50 final candidates that represent 5-10 distinct chemical scaffolds for purchase or synthesis and experimental validation.
- Create a weighted scoring system. Example:
The following table details key software, databases, and computational resources essential for executing the protocols described above.
Table 1: Essential Research Reagent Solutions for High-Throughput Virtual Screening.
| Category | Tool/Resource Name | Primary Function in HTVS | Access/Provider |
|---|---|---|---|
| Compound Libraries | ZINC20 | Largest freely accessible database of commercially available compounds for virtual screening (230+ million molecules). | Free / UCSF [61] |
| ChEMBL | Manually curated database of bioactive molecules with drug-like properties and associated bioactivity data. | Free / EMBL-EBI | |
| Target Structure | Protein Data Bank (PDB) | Primary repository for experimentally determined 3D structures of proteins and nucleic acids. | Free / wwPDB |
| AlphaFold Protein Structure Database | Provides highly accurate AI-predicted protein structures for the human proteome and model organisms. | Free / DeepMind-EMBL [62] [63] | |
| Structure-Based VS | AutoDock Vina | Widely used, open-source molecular docking engine for predicting ligand-protein binding modes and affinities. | Free / Scripps Research |
| GLIDE (Schrödinger) | High-performance, precision docking software with robust scoring functions, part of a commercial suite. | Commercial / Schrödinger | |
| Ligand-Based VS | PharmaGist | Online server for creating pharmacophore models from a set of active molecules. | Free / Tel Aviv University |
| RDKit | Open-source cheminformatics toolkit for fingerprint generation, similarity searching, and molecular property calculation. | Free / Open Source | |
| AI/ML & Scoring | DeepDock | Example of an AI-enhanced tool using deep learning to improve binding affinity prediction from docking poses. | Varies (Research) |
| KNIME or Python (scikit-learn) | Platforms for building custom machine learning models to classify actives/inactives or predict activity. | Free / Open Source [63] | |
| ADMET Prediction | SwissADME | Comprehensive web tool for predicting pharmacokinetics, drug-likeness, and medicinal chemistry friendliness. | Free / Swiss Institute of Bioinformatics |
| admetSAR | Online resource for predicting Absorption, Distribution, Metabolism, Excretion, and Toxicity (ADMET) properties. | Free / LMMD | |
| Visualization & Analysis | UCSF Chimera, PyMOL | Molecular visualization systems for analyzing protein-ligand interactions, binding poses, and structural biology data. | Free / UCSF; Commercial / Schrödinger |
| ChemDoodle | Chemical drawing software for creating publication-quality 2D structures and reaction mechanisms. | Commercial / iChemLabs [64] |
Quantitative Performance Metrics & Validation
A critical step in any HTVS campaign is the retrospective and prospective validation of the protocol's performance. Key quantitative metrics are used to evaluate success.
Table 2: Performance Metrics for Virtual Screening Protocols.
| Metric | Description | Formula/Interpretation | Benchmark Target |
|---|---|---|---|
| Enrichment Factor (EF) | Measures how much better the VS method is at identifying true actives compared to random selection. | EF = (Hitssampled / Nsampled) / (Hitstotal / Ntotal) Hitssampled: Actives in selected subset. Nsampled: Size of selected subset. Hitstotal: Total actives in database. Ntotal: Total compounds in database. | EF₁% > 20 indicates good early enrichment. |
| Area Under the ROC Curve (AUC-ROC) | Evaluates the overall ability of the scoring function to rank active compounds higher than inactives. | Plot of True Positive Rate vs. False Positive Rate at all thresholds. AUC ranges from 0 (perfect inverse) to 1 (perfect ranking). | AUC > 0.7 is acceptable; >0.8 is good; >0.9 is excellent. |
| Hit Rate (HR) | The percentage of experimentally tested virtual hits that confirm activity in a primary assay. | HR = (Confirmed Actives / Compounds Tested) × 100% | HR > 10-20% is considered successful for a novel target. |
| Ligand Efficiency (LE) | Normalizes the binding affinity of a hit by its size, identifying fragments or leads with optimal binding per atom. | LE = ΔG / HAC ΔG: Binding free energy (kcal/mol). HAC: Number of heavy (non-hydrogen) atoms. | LE > 0.3 kcal/mol per heavy atom is favorable for lead compounds. |
Case Study Context: In a study targeting Streptococcus mutans for dental caries, a computational screening of the proteome identified 63 peptide candidates. Subsequent synthesis and experimental testing of 54 peptides yielded only 3 with significant antibacterial activity [63]. This underscores a common reality: a hit rate of ~5.6%, highlighting the crucial role of robust post-screening triage (Protocol 3) to improve the quality of candidates advanced to costly experimental stages.
High-throughput virtual screening protocols have become indispensable in the CADD toolkit for lead identification. The integrated application of structure-based docking, ligand-based pharmacophore screening, and AI-enhanced prioritization, as detailed in these protocols, offers a powerful strategy to navigate vast chemical space efficiently.
The future of HTVS is inextricably linked with advancements in AI-driven drug discovery (AIDD). The integration of more sophisticated deep learning models for molecular property prediction, generative chemistry for designing novel libraries, and the use of predicted protein structures from tools like AlphaFold 3 will further increase the scope and accuracy of virtual screening [62] [63]. However, as evidenced by the gap between computational predictions and experimental results, rigorous validation and iterative cycles of computation and experiment remain the cornerstone of successful drug discovery. The protocols outlined herein provide a foundational framework for researchers to implement and adapt HTVS strategies within their molecular docking and lead discovery projects.
Within the broader thesis on computer-aided drug discovery (CADD), molecular docking stands as a cornerstone technique for predicting how small molecule ligands interact with biological targets. For decades, the dominant paradigm treated the protein receptor as a rigid, static entity—a digital manifestation of the lock-and-key model [65]. While computationally efficient, this simplification represents a fundamental limitation, as it ignores the dynamic nature of proteins that is critical for function, allostery, and drug resistance [66].
Experimental crystallography and NMR studies have definitively shown that proteins exist as ensembles of conformations, undergoing motions from side-chain rotations to large-scale backbone movements upon ligand binding [65]. The contemporary understanding of binding incorporates both induced-fit (where the ligand induces a conformational change) and conformational selection (where the ligand selects a pre-existing state from the ensemble) [66]. Consequently, docking into a single, rigid structure introduces a bias, particularly evident in cross-docking failures where a ligand cannot be correctly posed in a receptor structure solved with a different ligand [66].
The performance gap is quantitative. Traditional rigid-receptor docking shows success rates typically between 50% and 75% for correct pose prediction. In contrast, methods that incorporate significant protein flexibility can enhance success rates to 80–95% [66]. This substantial improvement underscores why handling protein flexibility is not merely a technical refinement but a necessary evolution for accurate binding mode prediction, reliable virtual screening, and the discovery of novel allosteric or cryptic pockets, as exemplified by the work on HIV integrase that led to Raltegravir [65]. This article details the conceptual and practical progression from treating receptors as rigid bodies to employing sophisticated protocols for backbone adaptation, providing application notes and reproducible protocols for researchers.
Methodological Hierarchy: From Local Sidechains to Global Backbone Motions
Strategies for incorporating flexibility form a hierarchy of increasing complexity and computational cost. The choice of method depends on the biological question, available structural data, and computational resources.
2.1 Local Flexibility: Side-Chain and Soft Docking The simplest approaches model flexibility near the binding site. Soft docking uses modified scoring potentials that tolerate minor steric clashes, mimicking slight atomic displacements [65]. More explicit methods allow side-chain flexibility using rotamer libraries or energy minimization for a defined set of binding site residues [65] [67]. A targeted strategy involves identifying a minimal set of flexible residues. Algorithms like SOFTSPOTS analyze structural data to pinpoint "soft" regions of the protein most likely to adapt, allowing focused sampling on key residues (e.g., 2-5 residues) rather than the entire binding site, balancing accuracy and cost [68].
2.2 Global Flexibility: Ensemble and Trajectory-Based Docking These methods account for larger conformational changes by utilizing multiple receptor structures.
- Ensemble Docking: Ligands are docked into a collection of experimentally derived (e.g., from multiple crystal structures or NMR models) or computationally generated conformations. The final score is derived from the best or average score across the ensemble [65] [69].
- Trajectory-Based Methods: Conformational ensembles are extracted from molecular dynamics (MD) or Monte Carlo simulations. This can be used for ensemble docking or to construct dynamic pharmacophore models that merge interaction features observed over time [65].
- Relaxed Complex Scheme (RCS): This method combines MD simulation with docking. An ensemble of snapshots from an MD trajectory of the apo receptor is used for docking, recognizing that ligands may bind to low-population ("rare") conformations sampled during the simulation [65].
2.3 Explicit Backbone Flexibility The most demanding level involves allowing the protein backbone to move during sampling. This is essential for modeling large-scale induced fit or designing protein binders.
- Normal Mode Analysis (NMA): Low-frequency collective motions are used to define plausible backbone deformation pathways for docking [65].
- Steered Molecular Dynamics (SMD): An external force is applied to a ligand to simulate its unbinding or binding pathway, providing insights into binding kinetics and mechanisms while allowing full backbone flexibility [70].
- Data-Driven Backbone Sampling: Methods like FlexiBaL-GP use machine learning (e.g., Gaussian Process Latent Variable Models) on multiple known structures to learn a lower-dimensional space of realistic backbone motions, which is then explored during computational protein design or docking [71].
Table 1: Quantitative Comparison of Docking Method Performance [66]
| Method Category | Typical Pose Prediction Success Rate | Key Computational Cost Factor | Best Use Case |
|---|---|---|---|
| Rigid Receptor Docking | 50% - 75% | Lowest | High-throughput screening of congeneric series; targets with rigid binding sites. |
| Flexible Side-Chain Docking | 60% - 85% | Moderate (scales with # flexible residues) | Lead optimization where side-chain rearrangements are critical. |
| Ensemble Docking | 70% - 90% | High (multiple docking runs) | Targets with multiple known conformations (apo/holo, open/closed). |
| Advanced Flexible Backbone Docking | 80% - 95% | Very High (MD/SMD, specialized sampling) | Discovery of cryptic pockets; modeling large-scale induced fit; protein design. |
Application Notes & Protocols
Protocol 1: Control and Validation for Large-Scale Ensemble Docking Adapted from best practices for robust virtual screening [10].
Objective: To establish a controlled workflow for running a virtual screen using an ensemble of receptor conformations, ensuring the docking parameters are validated before screening a large library.
Materials: Receptor structures (PDB format), known active ligands and decoy molecules, docking software (e.g., DOCK3.7, AutoDock Vina), high-performance computing cluster.
Procedure:
- Prepare the Receptor Ensemble: Curate 3-5 distinct conformations of the target protein from the PDB (prioritizing apo states and holo states with diverse chemotypes). Prepare each structure (add hydrogens, assign charges, remove crystallographic waters) consistently.
- Generate the Validation Set: Compile a set of 10-30 known actives for the target. Generate a decoy set of 100-1000 chemically similar but presumed inactive molecules using tools like DUD-E or from the ZINC15 database [10].
- Control Docking Calculation: Dock the combined active/decoy set into each receptor conformation individually. Use a standardized grid box centered on the binding site.
- Analyze Enrichment: For each conformation, calculate the enrichment factor (EF) at 1% of the screened database (e.g., how many actives are in the top 1% of ranked molecules). Plot ROC curves.
- Select Ensemble & Define Consensus Scoring: Identify which conformations yield the best early enrichment. Define a consensus scoring strategy for the full screen (e.g., take the best docking score for each ligand across the selected ensemble, or the average score).
- Execute Full Virtual Screen: Apply the validated parameters and consensus scoring to screen your ultra-large compound library (e.g., 1 million+ compounds).
- Post-Screen Analysis & Clustering: Visually inspect top-ranked unique chemotypes. Cluster results by molecular scaffold to prioritize diverse hits for experimental testing.
Protocol 2: Flexible Side-Chain Docking with AutoDock Vina Based on the official flexible docking tutorial [72].
Objective: To perform docking of a ligand into a receptor while allowing specified side-chains to be flexible.
Materials: Protein structure with hydrogens (receptorH.pdb), ligand file (ligand.pdbqt), software: Meeko, AutoDock Vina.
Procedure:
- Prepare Flexible Receptor: Use Meeko's
mk_prepare_receptorscript to split the receptor into rigid and flexible parts. This generatesreceptor_prepared_rigid.pdbqtandreceptor_prepared_flex.pdbqt(containing flexible residues, e.g., 126 and 203 in chain A). - Prepare Ligand: Generate the ligand PDBQT file using Meeko or other preparation tools.
- Run Flexible Docking: Execute Vina with the flexible receptor flag.
- Analyze Output: The output file contains multiple poses of the ligand and the corresponding conformations of the flexible side-chains for each pose. Analyze the interaction networks formed by the flexible residues.
Protocol 3: Modeling Unbinding Pathways with Steered Molecular Dynamics (SMD) Informed by recent studies on protein backbone restraint strategies [70].
Objective: To simulate the forced unbinding of a ligand from its protein target to study dissociation pathways and estimate relative binding strengths.
Materials: Solvated and equilibrated protein-ligand system, MD simulation software (e.g., GROMACS, NAMD), a defined pulling direction.
Procedure:
- System Preparation: Obtain a crystal structure of the protein-ligand complex. Solvate the system in a water box, add ions to neutralize, and minimize and equilibrate using standard MD protocols (e.g., NPT ensemble, 310K).
- Define Restraint Strategy: To prevent the entire protein from drifting during pulling, apply harmonic restraints to the protein backbone. Critical Note: Avoid restraining all heavy atoms or all Cα atoms, as this over-constrains the binding site. Instead, apply restraints only to Cα atoms located >1.2 nm from the ligand to allow natural, local flexibility near the active site [70].
- Set Up Pulling Parameters: Attach a virtual spring to the ligand's center of mass. Apply a constant velocity pull (e.g., 0.01 nm/ps) or a constant force pull along a vector defined from the binding site center to the bulk solvent.
- Run SMD Simulation: Perform multiple (5-10) independent pulling simulations to account for stochasticity. Record the force on the spring and the ligand position over time.
- Analyze Results: Plot force vs. distance (rupture curves). Identify major peaks corresponding to the breaking of key interactions (hydrogen bonds, hydrophobic contacts). Analyze the trajectory to visualize the unbinding pathway and identify "sticky" residues that interact with the ligand along the path.
Visualizing Strategies and Workflows
Hierarchical Strategy Selection for Flexible Docking
SMD Workflow for Studying Ligand Unbinding
The Scientist's Toolkit: Essential Research Reagents & Software
Table 2: Key Resources for Flexible Docking Research
| Category | Item / Software | Specific Function / Role | Example / Note |
|---|---|---|---|
| Software Suites | DOCK3.7 [10], AutoDock Vina [72], GOLD, Glide [15] | Core docking engines with varying support for side-chain and ensemble flexibility. | DOCK3.7 is free for academia; Vina supports limited side-chain flex. |
| Molecular Dynamics | GROMACS [70], AMBER, NAMD, OpenMM | Generate conformational ensembles (for RCS), run SMD simulations, refine poses. | GROMACS is widely used for SMD; AMBER common for force field param. |
| Force Fields | AMBER ff99SB-ILDN [70], CHARMM36, OPLS-AA | Define potential energy terms for MD simulations and some scoring functions. | AMBER ff99SB-ILDN used for protein in SMD studies [70]. |
| Machine Learning Tools | Gaussian Process Latent Variable Model (GP-LVM) [71] | Learns low-dimensional representations of backbone motions from multiple structures. | Core of the FlexiBaL-GP design strategy [71]. |
| Compound Libraries | ZINC15 [10], Enamine REAL, MCULE | Source of commercially available compounds for virtual screening. | ZINC15 is a free, public database of >230 million compounds [10]. |
| Analysis & Visualization | PyMOL [70], VMD, UCSF Chimera, RDKit | Visualize docking poses, analyze MD trajectories, and process chemical data. | PyMOL used for repairing missing residues in prep [70]. |
| Specialized Protocols | Relaxed Complex Scheme (RCS) [65], FlexiBaL-GP [71] | Specific methodological frameworks combining MD with docking or design. | RCS uses MD snapshots for docking; FlexiBaL-GP for protein design. |
Integrating protein flexibility is no longer a frontier challenge but an operational necessity in modern molecular docking within CADD pipelines. The field has matured from simple soft docking to robust protocols for ensemble docking and is now advancing towards the explicit treatment of backbone flexibility for specialized applications. The future lies in the intelligent integration of these methods. This includes on-the-fly machine learning to guide conformational sampling, the use of AlphaFold2 predicted ensembles as docking templates, and the development of multi-scale methods that combine fast docking with accurate MD refinement. Furthermore, addressing flexibility is intrinsically linked to improving scoring functions, which must accurately evaluate the free energy changes across diverse conformational states [66] [15]. By systematically applying the protocols and strategies outlined here—from controlled ensemble screens to SMD simulations—researchers can more accurately model the dynamic interplay between drug and target, ultimately increasing the predictive power and success rate of structure-based drug discovery.
Computer-Aided Drug Design (CADD) has fundamentally transformed the drug discovery landscape, shifting the paradigm from empirical screening to a rational, structure-informed process [73]. Central to this transformation is molecular docking, a computational technique that predicts how a small molecule ligand interacts with a biological target at the atomic level. By simulating the preferred orientation and binding affinity, docking facilitates virtual high-throughput screening (vHTS), lead optimization, and the elucidation of mechanisms of action [73] [74]. Within a broader thesis on molecular docking methods, this article presents detailed application notes and experimental protocols for its successful deployment against three critical therapeutic target classes: kinases, G protein-coupled receptors (GPCRs), and antimicrobial targets. These case studies exemplify the integration of docking with advanced computational techniques—including machine learning (ML), molecular dynamics (MD), and ultra-large library screening—to address specific challenges in modern drug discovery [74] [51] [75].
Case Study: Kinase Targeting with a Machine Learning-Enhanced Pipeline for GRK5 Inhibition
1.1 Background and Rationale G protein-coupled receptor kinase 5 (GRK5) is a critical regulator of cardiovascular function, and its overexpression is implicated in pathological cardiac remodeling and heart failure. Inhibiting GRK5 presents a promising therapeutic strategy for cardiovascular disease [75]. This case study details an integrated in silico campaign to identify novel GRK5 inhibitors from the 4-quinolone chemical class, demonstrating a modern ML-enhanced docking workflow.
1.2 Computational Workflow and Results The study employed a multi-stage computational pipeline to efficiently navigate chemical space [75].
- Dataset Curation and Filtering: An initial substructure search for 4-quinolones on PubChem yielded ~210,000 compounds. Sequential filtering based on Lipinski’s Rule of Five, Quantitative Estimate of Drug-likeness (QED > 0.7), and Synthetic Accessibility Score (SAScore < 4) refined the library to 58,556 candidates [75].
- Machine Learning-Based Classification: A message-passing neural network (MPNN) model was trained on known GRK5 inhibitors from the ChEMBL database. Applying this model to the filtered library classified 26,373 compounds as potentially active [75].
- Hierarchical Molecular Docking: The ML-prioritized compounds underwent structure-based screening using Schrödinger’s Glide in a stepwise manner: High-Throughput Virtual Screening (HTVS) → Standard Precision (SP) → Extra Precision (XP). This process identified five hit compounds with superior predicted binding affinities (ranging from -9.125 to -10.252 kcal/mol) compared to the reference ligand KR-39038 (-8.922 kcal/mol) [75].
- Validation via Free Energy Calculations and MD Simulations: The binding poses of the top hits were stabilized through Molecular Dynamics (MD) simulations over 100 nanoseconds. Post-simulation Molecular Mechanics/Generalized Born Surface Area (MM/GBSA) calculations confirmed favorable free binding energies, and ADMET predictions indicated promising drug-like properties [75].
Table 1: Top GRK5 Inhibitor Candidates Identified via ML-Docking Pipeline [75]
| Compound (PubChem ID) | Docking Score (kcal/mol) | MM/GBSA ΔG (kcal/mol) | Key Interaction Residues | Predicted ADMET Profile |
|---|---|---|---|---|
| 91,786,186 | -10.252 | -58.34 | Leu-106, Asp-311, Glu-312 | High GI absorption; No PAINS alerts |
| 14,795,803 | -9.847 | -52.17 | Val-104, Leu-106, Asp-311 | High GI absorption; CNS inactive |
| 45,920,092 | -9.220 | -49.88 | Leu-106, Glu-312, Lys-217 | Moderate permeability |
| 155,494,220 | -9.137 | -48.95 | Asp-311, Glu-312, Tyr-314 | High GI absorption |
| 152,753,635 | -9.125 | -47.62 | Val-104, Leu-106, Asp-311 | Low CYP2D6 inhibition |
| Reference (KR-39038) | -8.922 | -45.21 | Leu-106, Asp-311, Glu-312 | N/A |
1.3 Experimental Protocol: Integrated ML and Docking for Kinase Inhibitor Discovery
- Step 1 – Target and Library Preparation: Retrieve the high-resolution crystal structure of GRK5 (e.g., PDB ID: 8UAP). Prepare the protein using standard protocols: assign bond orders, add hydrogens, optimize H-bonds, and perform restrained minimization. For the ligand library, conduct a substructure search on public databases (e.g., PubChem) and filter based on drug-likeness rules (Lipinski, QED, SAScore) using RDKit or KNIME [75].
- Step 2 – Machine Learning Model Training and Screening: Curate a dataset of known active/inactive molecules for the target from ChEMBL. Train a classification model (e.g., MPNN, Random Forest) using molecular fingerprints or graph representations. Apply the trained model to score and prioritize the filtered library, selecting compounds predicted as active for further analysis [75].
- Step 3 – Hierarchical Docking: Generate a receptor grid centered on the co-crystallized ligand’s binding site. Perform initial high-throughput docking (HTVS or similar) of the ML-prioritized library. Select the top 10-20% of compounds for more rigorous, precision docking (SP/XP modes). Analyze the top-scoring poses for conserved interactions with key catalytic or binding site residues [75].
- Step 4 – Post-Docking Analysis and Validation: Subject the top 10-20 complexes to MD simulation (≥100 ns) in explicit solvent to assess stability. Calculate binding free energies using MM/PBSA or MM/GBSA on equilibrated trajectory frames. Finally, predict ADMET properties using tools like SwissADME or admetSAR to triage compounds with undesirable profiles [75].
Case Study: Leveraging Allosteric Sites for Selective GPCR Modulation
2.1 Background and Rationale GPCRs represent the largest family of drug targets, with approximately 34% of FDA-approved drugs acting on them [76]. A major challenge in GPCR drug discovery is achieving subtype selectivity to minimize side effects, as orthosteric sites are often conserved. Targeting allosteric sites, which are topographically distinct and less conserved, offers a promising route to develop highly selective modulators [76].
2.2 Computational Insights and Workflow The explosion of GPCR structural biology, driven by cryo-electron microscopy (cryo-EM), has provided atomic-resolution insights into allosteric pockets located in the extracellular vestibule, transmembrane domains, and intracellular surfaces [76]. These structures enable structure-based drug design (SBDD) for allosteric modulators.
- Structure-Based Virtual Screening: Using experimentally determined structures of GPCRs with bound allosteric modulators, molecular docking can screen ultra-large libraries to discover novel chemical matter that binds to these specific pockets. A landmark study used such an approach to discover sub-nanomolar hits for melatonin receptors [74].
- Design of Bitopic Ligands: Computational modeling is crucial for designing bitopic ligands that span both orthosteric and allosteric sites. Docking and MD simulations help in linking optimized pharmacophores and predicting the bound conformation of these hybrid molecules, which can offer improved affinity and unique signaling profiles (biased agonism) [76].
Table 2: Performance Metrics of a Virtual Screening Pipeline for Antimicrobial Discovery [77]
| Screening Outcome | Number of Compounds | Percentage of Library | Interpretation |
|---|---|---|---|
| True Positive (TP) | 26 | 18% | Correctly predicted active; high priority for experimental testing. |
| False Positive (FP) | 82 | 57% | Predicted active but experimentally inactive; major source of wasted resource. |
| True Negative (TN) | 25 | 17% | Correctly predicted inactive. |
| False Negative (FN) | 12 | 8% | Predicted inactive but experimentally active; potential missed opportunities. |
Note: Analysis of 145 bioactive compounds screened against DNA gyrase, highlighting the critical need for robust cheminformatics and validation to reduce false positives [77].
2.3 Experimental Protocol: Targeting GPCR Allosteric Sites
- Step 1 – Target Selection and Preparation: Select a GPCR target with a resolved structure containing an allosteric modulator (from PDB). Prepare the protein structure, paying special attention to the correct protonation states of residues in the allosteric pocket. Define the docking grid explicitly around the coordinates of the known allosteric ligand [76].
- Step 2 – Focused Library Docking: If known allosteric modulators exist, perform similarity searches or pharmacophore-based screening to create a focused library enriched for allosteric chemotypes. Dock this library into the defined allosteric grid. For de novo discovery, perform ultra-large library docking (e.g., using ZINC20) with efficient screening software [74] [76].
- Step 3 – Analysis of Binding Modes and Selectivity: Critically analyze top poses for interactions unique to the allosteric pocket and the target GPCR subtype. Compare binding modes against homology models of related GPCR subtypes to in silico assess selectivity.
- Step 4 – Functional Prediction via MD Simulations: Run MD simulations on the GPCR-ligand complex embedded in a lipid bilayer. Analyze the simulation to determine if the ligand binding stabilizes conformational states associated with specific signaling pathways (e.g., G-protein vs. β-arrestin recruitment), predicting functional bias [76].
Case Study: Validating a Virtual Screening Protocol for Antimicrobial DNA Gyrase Inhibitors
3.1 Background and Rationale The rise of antimicrobial resistance necessitates accelerated discovery of new antibiotics. DNA gyrase is a validated essential bacterial target. This case study evaluates a computational pipeline to assess the validity of comparing novel bioactive compounds to inappropriate standard drugs in experimental assays—a common flaw in the literature that leads to misinterpretation of efficacy [77].
3.2 Computational Workflow and Performance Analysis A curated set of 145 bioactive compounds with reported experimental antibacterial activity were docked against DNA gyrase (PDB: 2XCT) using AutoDock Vina [77].
- Virtual Screening and Classification: The docking scores were used to predict activity, which was then compared to the reported experimental results. Compounds were classified into four categories: True Positive (TP), False Positive (FP), True Negative (TN), and False Negative (FN) [77].
- Critical Findings: The analysis revealed a 57% false positive rate, significantly highlighting the risk of relying solely on docking scores without careful cheminformatics analysis and experimental validation. Only 18% of compounds were true positives. This study underscores the necessity of using cheminformatics to select chemically appropriate standard comparators and employing robust, multi-step virtual screening protocols [77].
3.3 Experimental Protocol: A Robust Virtual Screening Pipeline for Antimicrobials
- Step 1 – Define the Target and Prepare a Focused Library: Choose an essential, well-validated antimicrobial target (e.g., DNA gyrase, DHFR). Prepare a compound library that includes known inhibitors (for validation) and novel compounds (e.g., natural product derivatives). Pre-filter the library based on physicochemical properties relevant to bacterial cell penetration [77].
- Step 2 – Rigorous Molecular Docking: Use a reliable docking program (e.g., AutoDock Vina, Glide). Define the grid box carefully around the active site of a high-resolution target structure. Run docking simulations and extract binding energies and poses for all compounds. Do not consider docking score alone as a definitive activity predictor [77].
- Step 3 – Post-Docking Analysis and Filtering: Analyze the binding modes of top-scoring compounds. Filter out molecules that do not form key interactions (e.g., with catalytic residues). Apply additional filters like interaction fingerprint similarity to known actives or pharmacophore matching. This step is critical to reduce false positives [77].
- Step 4 – Experimental Triaging and Validation: Rank the filtered compounds. Prioritize for in vitro testing those with promising scores, good binding modes, and favorable in silico ADMET profiles. The experimental results should then be used to retrospectively refine the computational models [77].
The Scientist's Toolkit: Essential Research Reagents & Solutions
Table 3: Key Software, Databases, and Resources for CADD Applications
| Tool/Resource Name | Category | Primary Function in Workflow | Application in Case Studies |
|---|---|---|---|
| Schrödinger Suite (Glide, Maestro) | Docking & Modeling | High-accuracy molecular docking, protein preparation, and binding site analysis. | Used for hierarchical SP/XP docking in the GRK5 kinase study [75]. |
| AutoDock Vina | Docking | Fast, open-source protein-ligand docking for virtual screening. | Used for screening compounds against DNA gyrase in the antimicrobial study [77]. |
| PyMOL / ChimeraX | Visualization | 3D visualization and analysis of protein-ligand complexes and binding poses. | Essential for analyzing docking results and interaction diagrams across all studies. |
| GROMACS / AMBER | MD Simulation | Performing molecular dynamics simulations to assess complex stability and dynamics. | Used for 100ns MD simulations to validate GRK5 inhibitor binding [75]. |
| RDKit | Cheminformatics | Open-source toolkit for cheminformatics, filtering, and descriptor calculation. | Used for applying Lipinski’s rules and calculating molecular properties [75]. |
| PubChem | Chemical Database | Public repository for chemical structures, properties, and bioactivity data. | Source for the initial 4-quinolone library in the GRK5 study [75]. |
| ChEMBL | Bioactivity Database | Curated database of bioactive molecules with drug-like properties and assay data. | Source of known active/inactive compounds for ML model training in the GRK5 study [75]. |
| ZINC20 | Virtual Compound Library | Free database of commercially available and virtually generated compounds for screening. | Representative of ultra-large libraries used in modern virtual screening [74]. |
| AlphaFold2 / ESMFold | Structure Prediction | AI-based protein structure prediction for targets lacking experimental structures. | Enables SBDD for targets where experimental structures are unavailable [73]. |
These case studies demonstrate that molecular docking is not a standalone technique but the core of an integrated computational discovery engine. The future of CADD lies in the deeper convergence of physics-based methods (docking, MD) with artificial intelligence, as highlighted by the 2025 Gordon Research Conference on the subject [78]. Key trends include: the use of AI for de novo molecular generation and activity prediction [51]; the screening of ultralarge, make-on-demand chemical libraries exceeding billions of compounds [74]; and the development of more generalizable ML scoring functions to bridge the accuracy-speed gap [79]. Furthermore, the integration of computational predictions with high-throughput experimental validation, including DNA-encoded library technology and automated synthesis, is creating iterative, accelerated design-make-test-analyze cycles. As these technologies mature, computational-aided molecular docking will continue to democratize and revolutionize drug discovery across kinase, GPCR, and antimicrobial targets, moving towards more predictive, efficient, and personalized therapeutic development.
Solving Common Docking Challenges and Enhancing Prediction Accuracy
Addressing Scoring Function Limitations and Binding Affinity Prediction Errors
In computer-aided drug discovery (CADD), molecular docking is a cornerstone technique for predicting how small molecule ligands interact with biological target proteins. The reliability of these predictions hinges on scoring functions—mathematical models that estimate the binding affinity between molecules [32]. Scoring functions are pivotal for virtual screening of large compound libraries, de novo design, and lead optimization [32]. However, the accurate prediction of binding affinity remains a significant challenge, often cited as a grand challenge in the field [80]. Despite technological advances, these functions are hampered by simplified physical models, inadequate treatment of solvation and entropy, and limitations in training data, leading to errors that can misdirect entire discovery campaigns [81] [50]. This document, framed within a broader thesis on CADD methodologies, provides detailed application notes and protocols designed to help researchers systematically identify, address, and validate solutions to these critical limitations.
Systematic Classification of Scoring Function Limitations
The inaccuracies in binding affinity prediction stem from interconnected limitations inherent to classical scoring function approaches and their application. These can be categorized as theoretical, methodological, and data-related.
Table 1: Taxonomy of Key Scoring Function Limitations and Their Impact
| Limitation Category | Specific Limitation | Description | Impact on Binding Affinity Prediction |
|---|---|---|---|
| Theoretical & Physical Model | Simplified Interaction Potentials | Use of simplified, pairwise potentials (e.g., Lennard-Jones, Coulomb) that fail to capture polarization, charge transfer, and halogen bonding [32]. | Poor estimation of enthalpic contributions, leading to systematic errors in absolute affinity. |
| Inadequate Solvation & Entropy | Crude treatment or neglect of desolvation penalties and conformational entropy changes upon binding [32] [81]. | Major source of error, as these terms are critical for accurate free energy (ΔG) prediction. | |
| Methodological | Rigid Receptor Approximation | Treating the protein as a static entity, ignoring side-chain and backbone flexibility induced by ligand binding (induced fit) [34]. | Failure to predict correct binding modes for ligands that require protein adaptation, reducing pose and affinity accuracy. |
| Pose Generation Error | Discrepancy between computationally docked poses and the experimental (crystallized) geometry [82]. | Can propagate errors to affinity prediction, though its impact may be smaller than once assumed [82]. | |
| Data & Application | Limited & Biased Training Data | Reliance on limited, often non-diverse sets of high-resolution protein-ligand complexes with associated affinity data [83] [50]. | Models fail to generalize to novel protein classes or chemical scaffolds (poor "vertical" test performance) [83]. |
| Overfitting & Lack of Interpretability | Particularly in machine-learning (ML) scoring functions, complex models may memorize dataset artifacts rather than learn underlying physics [80] [50]. | High performance on training/benchmark sets but unreliable prospective performance and little chemical insight. |
Core Protocols for Addressing Key Limitations
Protocol 1: Correcting for Pose Generation Error in Affinity Prediction
Contrary to common belief, pose generation error does not always catastrophically impact affinity prediction [82]. This protocol outlines a procedure to calibrate scoring functions using docked poses to minimize this error source.
Objective: To train a scoring function that learns the relationship between docked pose features and experimental binding affinity, thereby making the model robust to pose inaccuracies encountered in real-world virtual screening.
Materials: Software: Docking program (e.g., AutoDock Vina [82]), scripting environment (Python/R). Data: A curated set of protein-ligand complexes with known experimental binding affinities (e.g., from PDBbind [81]).
Procedure:
- Data Preparation & Docking: For each complex in the dataset, separate the ligand from the experimental structure. Generate multiple binding poses (e.g., 9 poses as in AutoDock Vina) by re-docking the ligand into the prepared protein structure [82].
- Feature Extraction: For each generated pose, calculate a set of relevant features. These can be:
- The unweighted terms from a classical scoring function (e.g., Vina's Gaussian, repulsion, hydrophobic, hydrogen bonding terms for both intermolecular and intramolecular energy) [82].
- Extended physics-based or knowledge-based descriptors (e.g., RF-Score features counting protein-ligand atom pairs) [82].
- Model Training with Docked Poses: Associate the calculated features from the docked poses—not the crystal pose—with the experimental binding affinity of the complex.
- Critical Decision Point: Choose a single, representative docked pose per ligand (e.g., the top-ranked pose) for training, as this strategy has shown better results than using multiple poses per ligand [82].
- Machine Learning Model Implementation: Train a non-linear regression model (e.g., Random Forest) on the feature-affinity pairs. This allows the model to learn the functional form directly from data, correcting for systematic biases introduced by the docking engine's pose generation [82].
- Validation: Perform rigorous cross-validation, ensuring that proteins in the test set are not represented in the training set (a "vertical" test) to assess generalizability.
Protocol 2: Developing Target-Specific Scoring Functions
General scoring functions often perform inconsistently across different protein target classes [81]. Target-specific functions, trained on data relevant to a single protein or protein family, can offer superior predictive accuracy.
Objective: To create a high-accuracy scoring function tailored for a specific drug target (e.g., a protease or a protein-protein interaction target) by leveraging available structural and affinity data for that target.
Materials: Software: Docking suite (e.g., GOLD within MOE [83]), ML library (Scikit-learn, XGBoost). Data: All known ligand structures and binding affinities (pKi or pKd) for the target from BindingDB [83] or ChEMBL.
Procedure:
- Target-Focused Data Curation: Compile a comprehensive set of ligands with experimental binding data for the target. Prepare the 3D structure of the target protein (experimental or high-quality homology model).
- Computer-Generated Complex Database: For each ligand, use a docking engine to generate multiple putative binding poses. Select the best pose based on a consensus or a classical score to create a "computer-generated database" of target-ligand complexes [83]. This step is crucial as it can provide a larger, tailored training set than available experimental structures alone.
- Feature Engineering with Physics-Based Descriptors: Calculate descriptors that capture key physics of the interaction. Recommended descriptors include:
- Optimized MMFF94S force-field terms for van der Waals and electrostatics.
- Terms for solvation and lipophilic interactions.
- An improved term for ligand torsional entropy penalty upon binding [81].
- Model Training and Selection: Train multiple model types:
- Validation: Validate the final model rigorously using time-split or cluster-based splits to avoid artificial inflation of performance due to structural similarities between training and test ligands.
Protocol 3: Integrating Multi-Method Validation and Controls
To mitigate risks from any single method's limitations, a consensus and controlled validation strategy is essential, especially for prospective virtual screening [10].
Objective: To establish a workflow that incorporates controls and orthogonal validation methods to distinguish true hits from false positives arising from scoring function artifacts.
Materials: Software: Multiple docking/scoring programs (e.g., DOCK3.7, Glide [10] [34]), molecular dynamics (MD) simulation package (e.g., OpenMM, GROMACS).
Procedure:
- Pre-Screen Control Calculations: Before large-scale docking, perform control calculations to optimize docking parameters [10].
- Known Actives/Decoys: Dock a set of known active ligands and experimentally confirmed inactive molecules (decoys) to ensure the protocol can enrich actives.
- Self-Docking: Re-dock cognate ligands from experimental structures to verify pose prediction accuracy (target: RMSD < 2.0 Å).
- Consensus Scoring: Screen the compound library using more than one scoring function (e.g., empirical, knowledge-based, and an ML-based function). Prioritize compounds that are ranked highly by multiple, structurally diverse scoring schemes [10].
- Post-Docking Filtering with Machine Learning: Train a classifier (e.g., Random Forest) to distinguish between native-like and non-native poses based on structural features, not just energy scores. This can significantly reduce false positive poses [10].
- Higher-Tier Validation with MD/MM-GBSA: For a shortlist of top-ranked virtual hits, perform more rigorous but computationally expensive validation:
- Run short MD simulations (5-10 ns) to assess complex stability.
- Use MM/GBSA or MM/PBSA calculations on simulation snapshots to obtain a refined, ensemble-averaged binding affinity estimate [84].
- Experimental Triangulation: Design the virtual screening workflow to propose compounds that are not just high-scoring, but also synthetically accessible and diverse. Plan for iterative cycles of computational prediction and experimental testing.
Understanding the magnitude and source of errors is key to selecting the right corrective strategy. Prediction methods exist on a continuum from fast/approximate to slow/accurate [84].
Table 2: Sources and Scale of Errors in Binding Affinity Prediction Methods
| Error Source / Method | Typical RMSE (kcal/mol) | Root Cause of Error | Primary Effect |
|---|---|---|---|
| Classical Docking (Fast) | 2.0 - 4.0 [84] | Simplified potentials, fixed protein, poor solvation/entropy. | Low correlation (R ~0.3), unreliable absolute affinity; useful for rough ranking [84]. |
| Machine-Learning Scoring | 1.2 - 2.0 [81] | Bias in training data, overfitting, failure to learn physical mechanisms [83]. | Good performance on similar data ("horizontal" tests), poor generalization to new targets ("vertical" tests) [83]. |
| MM/GBSA & MM/PBSA (Medium) | ~1.5 - 3.0 [84] | Cancellation of large enthalpy/solvation errors, crude entropy estimation. | Unreliable for ranking congeneric series; sensitive to input pose and sampling. |
| Free Energy Perturbation (Slow/Accurate) | ~1.0 [84] | Sampling limitations, force field inaccuracies. | Considered the most reliable computational method for relative binding affinity within a series; high computational cost. |
The Scientist's Toolkit: Essential Research Reagent Solutions
Table 3: Key Software, Databases, and Resources for Scoring Function Research
| Tool/Resource Name | Type | Primary Function in Protocol | Key Application / Note |
|---|---|---|---|
| AutoDock Vina [82] | Docking Software | Pose generation and baseline scoring in Protocol 1. | Popular for its speed and open-source nature; provides unweighted terms for ML feature extraction [82]. |
| RF-Score [82] [83] | Machine-Learning SF | Provides robust atomic pair-count features for training ML models (Protocols 1 & 2). | Pioneering ML-based SF; features help models learn from structural data. |
| PDBBind Database [83] [81] | Curated Dataset | Source of experimental protein-ligand complexes and binding affinities for training and testing. | The standard benchmark dataset; includes "core set" for independent testing [81]. |
| BindingDB [83] | Bioactivity Database | Source of target-specific ligand and affinity data for Protocol 2. | Critical for compiling comprehensive datasets for specific protein targets. |
| DOCK3.7 [10] | Docking Software | Used for large-scale virtual screening with customizable grids and scoring in Protocol 3. | Enables screening of ultra-large libraries; academic license available. |
| Glide (Schrödinger) [34] | Docking Software | Provides high-accuracy docking (SP/XP) and induced fit protocols for control studies. | Industry-standard; used for rigorous pose prediction and enrichment studies [34]. |
| GOLD / MOE [83] | Docking Suite | Used to generate computer-generated databases of poses for target-specific training. | Commercial software with flexible docking engines and scoring functions. |
| MM/GBSA & MM/PBSA [84] | End-Point Method | Used for higher-tier validation of shortlisted hits in Protocol 3. | More accurate than docking but less reliable than FEP; requires careful setup. |
Addressing the limitations of scoring functions is not a singular task but requires a multifaceted strategy. As outlined in these protocols, solutions include correcting for systematic errors like pose generation, developing target-tailored models to improve generalizability, and implementing rigorous multi-method validation to safeguard against the failure modes of any single approach. The future of accurate binding affinity prediction lies in the synergistic integration of physics-based models with machine learning, leveraging large-scale computed datasets, and adhering to stringent validation practices to move beyond retrospective benchmarks to successful prospective discovery [80] [50]. Researchers must select and combine protocols based on their specific target, data availability, and computational resources to build a robust, error-aware CADD pipeline.
Strategies for Managing Ligand and Protein Flexibility in Complex Systems
Molecular docking is a foundational computational technique in structure-based drug discovery, tasked with predicting the optimal binding pose and affinity between a small molecule (ligand) and a target protein. A persistent, central challenge in the field is the accurate incorporation of molecular flexibility—the dynamic conformational changes both the ligand and protein undergo upon binding. Traditional docking methods, which often treat the protein as rigid, struggle with real-world scenarios like docking to unbound (apo) protein structures or identifying novel binding sites, limiting their predictive accuracy and utility in virtual screening [12]. This article, framed within broader research on computer-aided drug discovery methods, details modern computational strategies designed to overcome these limitations. We provide a comparative analysis of deep learning-based and ensemble docking approaches, which represent the current forefront in managing flexibility [16] [85]. Furthermore, we present detailed, actionable protocols for implementing an ensemble docking workflow—a proven method to implicitly account for protein dynamics—using molecular dynamics (MD) simulations for conformational sampling and the HADDOCK software for information-driven flexible docking [86]. These application notes and protocols aim to equip researchers with the practical knowledge to enhance the reliability of their docking predictions in complex, flexible systems.
The primary goal of molecular docking is to predict the three-dimensional structure of a protein-ligand complex and estimate the strength of their interaction (binding affinity). In practice, this involves two core computational tasks: sampling the vast conformational space of the ligand relative to the protein, and scoring these sampled poses to identify the most probable binding mode [86]. The intrinsic flexibility of both molecules makes this a formidable challenge. Ligands can adopt multiple rotameric states, while proteins can exhibit everything from side-chain rearrangements to large-scale backbone movements upon ligand binding, a phenomenon known as induced fit [12].
Most conventional docking programs simplify this problem by treating the protein receptor as a rigid body, allowing flexibility only for the ligand. While computationally efficient, this "rigid receptor" assumption is a significant source of failure, particularly when docking to structures that differ from the ligand-bound conformation. This is critical in real-world drug discovery, where the only available structure may be an apo form (without ligand) or a homology model [12]. The inability to account for protein flexibility leads to poor pose prediction and unreliable virtual screening results, ultimately hindering lead identification and optimization.
To address this, the field has evolved several key strategies. Ensemble docking is a well-established approach that involves docking ligands into an ensemble of multiple protein conformations, thereby capturing a range of possible receptor states [85] [86]. Simultaneously, a new generation of deep learning (DL)-based docking methods is emerging, leveraging powerful neural networks to directly predict complex structures, with some models explicitly designed to handle flexible protein backbones and side-chains [12] [16]. The following sections provide a detailed examination of these strategies, supported by quantitative comparisons and step-by-step experimental protocols.
Comparative Analysis of Docking Strategies for Flexibility
A comprehensive evaluation of docking methods reveals a trade-off between pose accuracy and the physical plausibility of the generated complexes. The table below summarizes the performance of traditional, deep learning-based, and hybrid docking methods across three benchmark datasets of varying difficulty: the Astex diverse set (known complexes), the PoseBusters benchmark (unseen complexes), and the DockGen dataset (novel protein pockets) [16].
Table 1: Performance Comparison of Docking Methods Across Key Benchmarks [16]
| Method Category | Specific Method | Astex Diverse Set (% ≤2Å & PB-valid) | PoseBusters Benchmark (% ≤2Å & PB-valid) | DockGen Novel Pockets (% ≤2Å & PB-valid) | Key Strength | Key Limitation |
|---|---|---|---|---|---|---|
| Traditional Physics-Based | Glide SP | 68.24% | 60.00% | 51.60% | High physical validity & robustness. | Computationally expensive; limited explicit flexibility. |
| AutoDock Vina | 42.35% | 34.38% | 29.63% | Fast, widely accessible. | Lower accuracy on challenging targets. | |
| Deep Learning: Generative Diffusion | SurfDock | 61.18% | 39.25% | 33.33% | Superior pose prediction accuracy. | Moderate physical validity; can produce steric clashes. |
| DiffBindFR (SMINA) | 41.18% | 34.58% | 23.28% | Good balance for known complexes. | Performance drops on novel pockets. | |
| Deep Learning: Regression-Based | KarmaDock | 11.76% | 13.75% | 12.35% | Very fast prediction. | Poor physical validity and general accuracy. |
| Hybrid (AI Scoring + Traditional Search) | Interformer | 47.06% | 46.88% | 38.27% | Best balance between AI and physics. | Dependent on underlying search algorithm. |
Analysis of Performance Trends: The data indicates a clear stratification. Traditional methods like Glide SP consistently achieve the highest combined success rate (posing within 2Å Root-Mean-Square Deviation (RMSD) and being physically plausible according to PoseBusters criteria), demonstrating robust generalization across diverse and novel targets [16]. Generative diffusion models like SurfDock excel at predicting accurate ligand poses (high RMSD success rate) but often generate structures with physical imperfections, such as incorrect bond lengths or steric clashes, lowering their PB-valid scores [12] [16]. Regression-based DL models, while fast, currently lag significantly in both accuracy and physical realism.
This underscores a critical insight: there is no single superior method for all scenarios. The choice depends on the task. For high-throughput virtual screening where known binding sites are targeted, robust traditional or hybrid methods may be preferred. For blind docking or exploring proteins with extreme flexibility, the latest flexible DL models or ensemble-based approaches are essential.
Experimental Protocol: Ensemble Docking with MD-Based Conformational Sampling
Ensemble docking is a practical and powerful strategy to incorporate protein flexibility. It involves generating multiple, distinct conformations of the target protein and performing docking calculations against each member of this ensemble. The final prediction is derived from the consensus or best-scoring result across all runs. The following protocol details how to create a protein ensemble using molecular dynamics (MD) simulations and utilize it for flexible docking with the HADDOCK server [85] [86].
Protocol: Generating a Protein Conformational Ensemble via MD Simulation
Objective: To produce a diverse set of biologically relevant protein conformations for subsequent ensemble docking.
Materials & Software:
- Initial Protein Structure: Apo (unliganded) protein structure in PDB format (e.g., PDB ID: 1JEJ) [86].
- MD Software: GROMACS (version 2019 or later) [86].
- Force Field: GROMOS96 54a7 or AMBER99SB-ILDN [86].
- System Preparation Tools:
pdb2gmx,editconf,solvate,genion(within GROMACS). - Compute Resources: High-performance computing cluster with GPU acceleration recommended.
Procedure:
System Preparation: a. Clean PDB File: Remove crystallographic water molecules and heteroatoms not part of the protein. Ensure missing residues or atoms are noted. b. Generate Topology: Use
gmx pdb2gmxto process the cleaned PDB file. Select an appropriate force field (e.g.,14for GROMOS96 54a7) and water model (e.g., SPC/E). This command generates the protein topology (topol.top) and a processed structure file (conf.gro).c. Define Simulation Box: Use
gmx editconfto place the protein in a cubic box with a minimum distance of 1.0 nm between the protein and box edge. d. Solvation: Fill the box with water molecules usinggmx solvate. e. Neutralization: Add ions (e.g., Na⁺, Cl⁻) to neutralize the system's charge and achieve a physiologically relevant salt concentration (e.g., 0.15 M) usinggmx genion.Energy Minimization & Equilibration: a. Energy Minimization: Run a steepest descent minimizer to remove steric clashes introduced during system setup. Use a custom
.mdpparameter file.b. NVT & NPT Equilibration: Perform two equilibration phases. First, under constant Number of particles, Volume, and Temperature (NVT) for 100 ps to stabilize the temperature. Second, under constant Number of particles, Pressure, and Temperature (NPT) for 100-200 ps to stabilize the pressure and density of the system.
Production MD Simulation: a. Run Simulation: Execute an unbiased production MD simulation for a duration sufficient to sample relevant flexibility (typically 50-500 ns, depending on protein size and dynamics). Save trajectory frames every 10-100 ps.
Trajectory Analysis & Clustering: a. Analyze Stability: Calculate the protein backbone RMSD over time to confirm the simulation has stabilized. b. Cluster Conformations: Use a clustering algorithm (e.g., GROMACS
gmx clusterusing the linkage method) on the protein backbone atoms of the stable portion of the trajectory. This groups similar conformations and identifies representative structures (cluster centroids). c. Select Ensemble: Extract the PDB structure of each cluster centroid. These 5-20 representative structures form your conformational ensemble for docking [85].
Diagram: MD Workflow for Generating a Protein Conformational Ensemble. The core production MD simulation (blue) generates dynamic data, which is analyzed and clustered (green) to produce the final ensemble of representative structures (red).
Protocol: Flexible Ensemble Docking with HADDOCK
Objective: To perform information-driven flexible docking of a ligand against an ensemble of protein conformations using the HADDOCK web server.
Materials & Software:
- Protein Ensemble: Multiple PDB files from the MD clustering protocol (Section 3.1).
- Ligand File: 3D structure of the small molecule in MOL2 or SDF format, with optimized geometry and assigned charges.
- HADDOCK Web Server: Access to https://wenmr.science.uu.nl/haddock2.4/ [87].
- Optional: Known or predicted active site residue information.
Procedure:
Input Preparation: a. Prepare Protein Files: Ensure each PDB file in your ensemble is clean (no alternate conformations, correct atom naming). You will submit these as multiple "molecules" for the same "Segment" in HADDOCK. b. Prepare Ligand File: Convert your ligand to a proper MOL2 file. Assign protonation states relevant to physiological pH and calculate partial charges (e.g., using GAFF2 in AMBER tools or the PRODRG server).
HADDOCK Job Submission: a. Register/Login: Create an account on the HADDOCK web server [87]. b. Select "Flexible Docking": On the submission page, choose the "Protein-Ligand" docking option. c. Upload Structures: - For the "Protein," upload all your ensemble PDB files. - For the "Ligand," upload the prepared MOL2 file. d. Define Interaction Restraints (Critical): - If the binding site is known, define "Active Residues" (directly involved in binding) and "Passive Residues" (neighboring residues). HADDOCK uses these Ambiguous Interaction Restraints (AIRs) to guide the docking. - If performing blind docking, you can omit this step, but results will be less precise. e. Adjust Sampling Parameters: Increase the number of models to generate (e.g., 1000 for rigid body docking, 400 for flexible refinement) to ensure adequate sampling across the ensemble. f. Submit the Job.
Analysis of Results: a. Cluster Analysis: HADDOCK clusters the generated models based on interface similarity. Inspect the top-ranking clusters. b. Evaluate Top Poses: Download the structures of the best-scoring models from the top clusters. Key metrics include the HADDOCK score (a weighted sum of energetic terms), cluster size, and RMSD from the cluster centroid. c. Cross-Ensemble Consensus: Compare the top poses generated from different protein conformations in your ensemble. A consistent binding mode across multiple receptor conformations strongly suggests a reliable prediction [85].
Diagram: HADDOCK Ensemble Docking Workflow. Defining ambiguous interaction restraints (green) based on known or predicted binding sites is a critical, information-driven step that guides the flexible sampling process (blue) toward a biologically relevant consensus pose (red).
Table 2: Key Research Reagent Solutions for Flexible Docking Studies
| Resource Name | Type | Primary Function in Flexibility Studies | Key Feature / Relevance |
|---|---|---|---|
| HADDOCK [87] [86] | Software Web Server | Information-driven flexible docking of biomolecules. | Supports explicit interface flexibility during refinement; can integrate diverse experimental data (NMR, cryo-EM) as restraints; ideal for ensemble docking. |
| GROMACS [86] | Software Suite | Molecular dynamics simulation. | Generates realistic protein conformational ensembles through unbiased or enhanced-sampling MD simulations for ensemble docking. |
| PDBBind Database | Dataset | Curated experimental protein-ligand complexes with binding affinity data. | Essential for training and benchmarking deep learning docking models; provides ground truth for re-docking and cross-docking tasks [12]. |
| AutoDock Vina [4] | Software | Traditional search-and-score molecular docking. | Fast, widely used baseline method; allows for limited ligand flexibility; useful for comparing against advanced flexible protocols. |
| Glide (Schrödinger) | Software | High-throughput molecular docking with hierarchical precision. | Represents high-performance traditional docking; robust scoring function often used as a benchmark for pose prediction and virtual screening accuracy [16]. |
| DiffDock / FlexPose [12] | Deep Learning Model | End-to-end prediction of protein-ligand complex structures. | New generation models that use diffusion processes or other DL architectures to handle protein side-chain and, in some cases, backbone flexibility directly. |
| PoseBusters [16] | Validation Tool | Checks physical and chemical plausibility of docking poses. | Critical for evaluating DL-generated poses, detecting steric clashes, incorrect bond lengths, and torsion angles that RMSD alone may miss. |
Protein-ligand interactions form the mechanistic foundation of most biological processes and are primary targets for therapeutic intervention in drug discovery [88]. The accurate identification of binding sites—specific regions on protein surfaces where small molecules, ions, or other biomolecules interact—is therefore a critical first step in structure-based drug design. These binding sites, often referred to as "pockets," typically represent cavities or depressions on the protein surface characterized by specific geometric and chemical properties that enable molecular recognition and binding [89]. The process of locating these sites has evolved significantly from early experimental methods to sophisticated computational approaches that now incorporate machine learning and artificial intelligence.
Experimental techniques such as X-ray crystallography, nuclear magnetic resonance (NMR), and cryo-electron microscopy can provide high-resolution structural data of protein-ligand complexes [88]. However, these methods are resource-intensive, time-consuming, and not always feasible for all targets, particularly when studying transient interactions or proteins that are difficult to crystallize [90]. Computational approaches have emerged as indispensable alternatives and complements to experimental methods, offering rapid predictions that guide experimental work and help prioritize targets.
The computational identification of binding sites generally follows two complementary paradigms: known pocket identification and blind docking approaches. Known pocket identification focuses on locating specific, predefined binding sites (such as active sites of enzymes or allosteric sites) using either geometric criteria, evolutionary conservation, or template-based methods. In contrast, blind docking involves searching the entire protein surface for potential binding regions without prior knowledge of specific sites, simulating a more realistic drug discovery scenario where binding sites may not be previously characterized [12]. Both approaches face significant challenges, including accounting for protein flexibility, distinguishing biologically relevant sites from geometric artifacts, and accurately predicting interactions for novel ligands not represented in training data [89].
Recent advances in deep learning and the increasing availability of protein structural data have revolutionized binding site prediction. Modern methods now integrate multiple data types—including sequence information, evolutionary profiles, geometric features, and chemical properties—to generate more accurate and generalizable predictions [88] [90]. These developments are particularly important for addressing challenging cases such as cryptic pockets (transient sites not visible in static structures) and allosteric sites, which represent promising targets for drug development [12].
Computational Methods for Binding Site Identification
Method Classification and Key Algorithms
Binding site identification methods can be categorized based on their input data, algorithmic approach, and target specificity. The following table summarizes the primary categories with representative methods and their characteristics.
Table 1: Classification of Computational Methods for Binding Site Identification
| Method Category | Representative Methods | Input Data | Key Principles | Strengths | Limitations |
|---|---|---|---|---|---|
| Geometry-based | CLIPPERS [91], GrASP [89] | Protein 3D structure | Analysis of surface cavities, convex hull deficiencies, and travel depth | Complete surface coverage; no training data required; finds all potential pockets | High false positive rate; may miss chemically relevant but geometrically subtle sites |
| Template-based | IonCom [88], MIB [88] | Protein structure or sequence | Alignment to known binding sites in homologous proteins | High accuracy when good templates exist; incorporates evolutionary information | Limited by template availability; fails for novel folds without homologs |
| Machine Learning (Single-ligand) | DELIA [88], GraphBind [88], LigBind [88] | Protein structure + specific ligand info | Specialized models trained for particular ligand types | High accuracy for specific ligands covered in training | Poor generalization to unseen ligands; requires multiple specialized models |
| Machine Learning (Multi-ligand) | P2Rank [89], DeepPocket [88], LABind [88] | Protein structure ± ligand information | Unified models trained on diverse ligands; some incorporate ligand awareness | Generalizable across ligand types; single model for multiple predictions | May overlook ligand-specific binding patterns; requires careful feature engineering |
| Deep Learning (Ligand-aware) | LABind [88] | Protein structure + ligand representation (e.g., SMILES) | Explicit modeling of protein-ligand interactions via attention mechanisms | Handles unseen ligands; learns interaction patterns; high accuracy | Computationally intensive; requires both protein and ligand as input |
| Sequence-based | TargetS [88], ESM-SECP [90] | Protein sequence only | Prediction from evolutionary profiles and sequence-derived features | Applicable when no structure available; uses abundant sequence data | Lower accuracy than structure-based methods; misses structural nuances |
Performance Comparison of Modern Methods
Recent benchmarking studies provide quantitative comparisons of binding site identification methods. The following table summarizes performance metrics across different evaluation datasets and benchmarks.
Table 2: Performance Comparison of Selected Binding Site Prediction Methods
| Method | Benchmark Dataset | AUPR | F1 Score | Top-1 Success Rate | Key Advancement |
|---|---|---|---|---|---|
| LABind [88] | DS1, DS2, DS3 (multi-ligand) | 0.742 (DS1) | 0.681 (DS1) | N/A | Ligand-aware prediction; generalizes to unseen ligands |
| Deep Origin PocketFinder [89] | Coach420 (Mlig-merged) | N/A | N/A | 89.2% | Optimized for docking workflows; reduces false positives |
| P2Rank [89] | Coach420 (Mlig-merged) | N/A | N/A | 82.3% | Machine learning-based; good general performance |
| GrASP [89] | Coach420 (Mlig-merged) | N/A | N/A | 80.1% | Geometry-based; no training required |
| ESM-SECP [90] | TE129 (DNA-binding) | 0.358 | 0.463 | N/A | Sequence-based; ensemble learning with protein language models |
| Traditional Docking (Smina) with LABind sites [88] | PDBBind | N/A | N/A | RMSD improvement: 0.7Å | Demonstrates value of accurate site prediction for docking |
Evolution from Traditional to Deep Learning Approaches
The field has evolved from early geometry-based methods to increasingly sophisticated machine learning approaches. Early geometry-based algorithms, such as those utilizing the "travel depth" concept, provided complete inventories of protein pockets by analyzing the distance from surface points to the protein's convex hull [91]. These methods tessellate the entire protein surface into hierarchical pocket regions but often generate many false positives because they consider only shape without chemical or evolutionary context.
The introduction of machine learning, particularly with methods like P2Rank, improved accuracy by incorporating both geometric features and chemical information to distinguish biologically relevant pockets from geometric artifacts [89]. However, these methods typically treated all ligands similarly, potentially missing ligand-specific binding patterns.
The most recent advancement comes with ligand-aware deep learning models such as LABind, which explicitly incorporate ligand information during prediction [88]. By using graph transformers and cross-attention mechanisms, these models learn the distinct binding characteristics between proteins and specific ligands, enabling them to generalize to ligands not seen during training. This represents a significant shift from methods that simply identify where pockets are to methods that predict where and how specific ligands will bind.
Simultaneously, sequence-based methods have advanced considerably with protein language models like ESM-2, enabling reasonable binding site predictions even when experimental structures are unavailable [90]. These methods extract features directly from protein sequences and can be particularly valuable for high-throughput applications or for proteins resistant to structural determination.
Experimental Protocols and Application Notes
Protocol for Known Pocket Identification Using LABind
Objective: To identify and characterize binding sites for specific small molecules or ions on a target protein using a ligand-aware deep learning approach.
Materials and Software Requirements:
- Protein structure in PDB format (experimental or predicted)
- Ligand information in SMILES format or as 3D molecular structure
- LABind software (available from original publication)
- Molecular visualization software (e.g., PyMOL, ChimeraX)
- Python environment with deep learning libraries (PyTorch)
Procedure:
Input Preparation:
- Prepare the protein structure file. If using a predicted structure (e.g., from AlphaFold2 or ESMFold), ensure proper formatting and consider confidence metrics [88].
- For the ligand, obtain the SMILES string or generate a 3D conformation using tools like RDKit or Open Babel.
- For sequence-based prediction (if no structure is available), prepare the protein sequence in FASTA format.
Feature Extraction:
- Generate protein embeddings using a pre-trained protein language model (Ankh for LABind) [88].
- Extract structural features using DSSP to obtain secondary structure and solvent accessibility profiles [88].
- For the ligand, generate molecular representations using a pre-trained molecular language model (MolFormer for LABind) [88].
- Convert the protein structure to a graph representation where nodes represent residues and edges represent spatial relationships.
Model Inference:
- Input the protein graph and ligand representation into the LABind model.
- The graph transformer processes local spatial contexts while cross-attention mechanisms capture protein-ligand interactions [88].
- The multi-layer perceptron classifier outputs binding probabilities for each residue.
Post-processing and Analysis:
- Apply a threshold (optimized via Matthews Correlation Coefficient) to convert probabilities to binary binding site predictions [88].
- Cluster predicted binding residues to identify binding site centers.
- Calculate confidence metrics for each predicted site.
- Visualize results by mapping predictions onto the protein structure.
Validation and Interpretation:
- Compare predictions with known binding sites from databases if available.
- Analyze chemical and physical properties of predicted sites (hydrophobicity, charge distribution, etc.).
- For novel predictions, consider experimental validation through mutagenesis or binding assays.
Expected Results and Interpretation:
- LABind typically achieves AUPR scores above 0.74 on benchmark datasets [88].
- The method significantly outperforms non-ligand-aware methods for unseen ligands.
- Predictions include both primary binding sites and potential allosteric sites.
- Results can guide focused docking studies or experimental design for binding assays.
Troubleshooting:
- For poor quality predictions with predicted structures, consider using ensemble approaches with multiple structure predictions.
- If the ligand is highly dissimilar to training data, consider additional validation steps.
- For proteins with conformational flexibility, consider using multiple conformations as input.
Protocol for Blind Docking Using GroupBind Framework
Objective: To perform blind docking of multiple ligands to a target protein without prior knowledge of binding sites, leveraging consistency across ligand binding poses.
Materials and Software Requirements:
- Protein structure in PDB format (apo or holo form)
- Multiple ligand structures in SDF or similar format
- GroupBind implementation (available from authors)
- Diffusion model framework (DiffDock as base)
- Computing resources with GPU acceleration
Procedure:
Input Preparation and Group Formation:
- Prepare the protein structure, focusing on the complete surface rather than predefined pockets.
- Curate a group of ligands known or suspected to bind to the target protein. These may come from:
- Known binders from literature or databases
- Similar molecules from virtual screening
- Diverse molecules for exploratory studies
- Format all ligands appropriately with correct stereochemistry and protonation states.
Representation and Graph Construction:
- Represent the protein as a residue-level graph with nodes containing amino acid type and Cα coordinates [92].
- Represent each ligand as a molecular graph with atom features and coordinates.
- Construct a combined representation that maintains separate identity for each ligand while enabling information sharing.
GroupBind Model Execution:
- Initialize the diffusion process with random ligand poses distributed around the protein surface.
- Employ the interaction layer that enables message passing among group ligands [92].
- Utilize the triangle attention module that processes protein-ligand and ligand-ligand pair representations [92].
- Run the reverse diffusion process to generate plausible binding poses for all ligands simultaneously.
- Apply the confidence model to rank predicted poses.
Pose Analysis and Binding Site Identification:
- Cluster ligand poses based on spatial similarity to identify consensus binding regions.
- Analyze protein-ligand interactions across the ligand group to identify conserved interaction patterns.
- Characterize identified binding sites by geometry, physicochemical properties, and conservation of interactions.
- Rank sites by frequency of ligand binding, predicted affinity, or other relevance metrics.
Validation and Refinement:
- Compare predictions with known binding sites if available.
- Perform focused re-docking into identified sites for higher accuracy.
- Consider molecular dynamics simulations to assess binding stability.
- Plan experimental validation for novel site predictions.
Expected Results and Interpretation:
- GroupBind demonstrates improved performance over single-ligand docking, particularly for challenging cases [92].
- The method identifies both primary binding sites and potential secondary/allosteric sites.
- Consistency across ligand poses provides higher confidence in predictions.
- Results enable structure-activity relationship analysis across ligand groups.
Troubleshooting:
- If ligands in the group have highly divergent binding modes, consider subgrouping or hierarchical approaches.
- For large protein surfaces, consider region-focused approaches to reduce computational cost.
- When experimental structures are unavailable, assess the impact of structural uncertainty on predictions.
Integration with Molecular Docking and Drug Discovery Workflows
From Binding Site Identification to Docking
Accurate binding site identification serves as a critical prerequisite for efficient molecular docking. The relationship between these steps forms a pipeline that significantly impacts the success of structure-based drug discovery.
Workflow for Integrating Binding Site Identification with Molecular Docking
The workflow demonstrates two primary pathways depending on prior knowledge of binding sites. When sites are known, docking proceeds directly to pose generation. When sites are unknown (more common in novel target discovery), binding site prediction precedes and guides focused docking. This hybrid approach, using computational methods to identify sites before docking, has been shown to improve docking accuracy compared to pure blind docking [12].
Practical Considerations for Different Docking Scenarios
Different drug discovery scenarios require tailored approaches to binding site identification and docking. The following table outlines recommended strategies for common scenarios.
Table 3: Recommended Approaches for Different Docking Scenarios
| Scenario | Recommended Binding Site Method | Recommended Docking Approach | Key Considerations |
|---|---|---|---|
| Re-docking (known complex) | Use known site from complex | Local docking with constraints | Validates method accuracy; assesses pose reproduction |
| Cross-docking (different ligand) | Use site from homologous complex | Flexible docking with sidechain optimization | Accounts for induced fit; tests generalizability |
| Apo-docking (no bound structure) | Predict sites using ligand-aware methods (e.g., LABind) | Blind docking or focused docking to predicted sites | Handles conformational changes; may require ensemble docking |
| Novel target, known ligand class | Predict using multi-ligand methods with similar ligands | Group docking (e.g., GroupBind) with ligand ensemble | Leverages ligand similarity; identifies conserved interactions |
| Cryptic pocket targeting | Use dynamics-based methods or specialized predictors | Flexible docking with protein conformational sampling | Requires enhanced sampling; may need MD simulations |
| High-throughput virtual screening | Use fast geometry-based or pre-computed sites | Sequential docking to prioritized sites | Balances speed and accuracy; often uses consensus sites |
The Scientist's Toolkit: Essential Research Reagents and Materials
Table 4: Essential Research Reagents and Computational Tools for Binding Site Studies
| Category | Item/Resource | Description/Purpose | Example Tools/Resources |
|---|---|---|---|
| Structural Data | Protein Data Bank (PDB) | Repository of experimentally determined protein structures for templates and benchmarking | RCSB PDB, PDBe, PDBj |
| Predicted Structures | AlphaFold2, ESMFold | High-accuracy protein structure prediction for targets without experimental structures | AlphaFold DB, ESM Metagenomic Atlas |
| Sequence Databases | UniProt, UniRef | Comprehensive protein sequence databases for evolutionary analysis and feature extraction | UniProtKB, UniRef90/50 |
| Ligand Databases | PubChem, ChEMBL | Small molecule databases for ligand information and similar compound identification | PubChem Compound, ChEMBL interface |
| Binding Site Benchmarks | Coach420, PDBBind | Curated datasets for method development and benchmarking | Coach420 dataset, PDBBind refined set |
| Protein Language Models | ESM-2, Ankh | Pre-trained models for generating protein sequence embeddings | ESM-2 variants, Ankh base/large |
| Molecular Language Models | MolFormer, ChemBERTa | Pre-trained models for molecular representation from SMILES or graphs | MolFormer, ChemBERTa-2 |
| Geometric Analysis | Travel Depth algorithms | Foundation for geometry-based pocket detection and characterization | CLIPPERS implementation [91] |
| Graph Neural Networks | PyTorch Geometric, DGL | Frameworks for implementing graph-based binding site predictors | PyG, Deep Graph Library |
| Docking Software | AutoDock, Smina, DiffDock | Molecular docking programs for pose prediction and scoring | AutoDock Vina, Smina, DiffDock |
| Visualization | PyMOL, ChimeraX | Molecular visualization for analyzing binding sites and docking results | PyMOL, UCSF ChimeraX |
| Workflow Management | Nextflow, Snakemake | Pipeline tools for reproducible binding site prediction workflows | Nextflow, Snakemake |
Challenges and Future Directions
Current Limitations and Research Gaps
Despite significant advances, binding site identification still faces several challenges that limit its accuracy and applicability in drug discovery:
Protein Flexibility and Dynamics: Most methods analyze static protein structures, missing transient pockets that emerge during conformational changes [12]. Cryptic pockets, which are not visible in apo structures but become accessible upon ligand binding or protein dynamics, represent particularly challenging yet therapeutically valuable targets. Methods like DynamicBind attempt to address this by modeling protein flexibility but require further development for general applicability [12].
Generalization to Unseen Targets and Ligands: While ligand-aware methods like LABind improve generalization, performance still degrades for proteins or ligands highly dissimilar to training data [88]. The extreme imbalance between binding and non-binding residues in proteins also poses challenges for machine learning models, potentially leading to overprediction or underprediction of sites [90].
Integration with Experimental Data: Computational predictions often lack seamless integration with experimental validation. Better pipelines that combine computational predictions with biophysical methods (such as fragment screening or hydrogen-deuterium exchange mass spectrometry) could accelerate the identification and validation of binding sites.
Evaluation Metrics and Standards: The field lacks standardized benchmarks and evaluation metrics, especially for challenging cases like allosteric sites or cryptic pockets. Most benchmarks focus on active sites of enzymes, potentially biasing method development toward these well-characterized sites [89].
Emerging Approaches and Future Outlook
Several promising directions are emerging that may address current limitations:
Integration of Multi-scale Data: Future methods will likely integrate data across multiple scales—from sequence and evolutionary information to structural dynamics and cellular context. For example, incorporating co-evolutionary signals from multiple sequence alignments alongside structural data has shown promise for identifying functional sites [90].
Generative Models for Binding Site Discovery: Rather than just predicting binding sites in existing structures, generative models could design protein conformations that create specific binding pockets, potentially enabling the targeting of proteins currently considered "undruggable."
Real-time Adaptivity and Active Learning: Methods that adapt predictions based on experimental feedback through active learning loops could significantly improve efficiency. As initial predictions are tested experimentally, results could refine subsequent computational searches.
Quantum Computing Applications: As quantum computing matures, it may enable more accurate modeling of protein-ligand interactions at the electronic level, potentially revealing binding sites and interaction mechanisms currently inaccessible to classical computational methods.
Future Research Directions in Binding Site Identification
The convergence of these approaches promises more accurate, comprehensive, and efficient binding site identification. As methods improve, they will enable targeting of more challenging protein classes, accelerate drug discovery timelines, and potentially reveal novel therapeutic opportunities in previously undruggable targets. The integration of binding site identification with downstream drug discovery steps—from docking to lead optimization—will become increasingly seamless, creating more efficient pipelines for therapeutic development.
Binding site identification has evolved from simple geometric analysis to sophisticated ligand-aware deep learning models that can generalize to unseen ligands and predict interaction patterns. The field now offers a spectrum of approaches, from fast geometry-based methods suitable for initial screening to advanced deep learning models appropriate for detailed characterization of specific protein-ligand interactions.
The distinction between known pocket identification and blind docking approaches is becoming increasingly blurred as methods incorporate elements of both. Modern blind docking often includes initial binding site prediction to focus the search, while known pocket methods are expanding to identify secondary and allosteric sites beyond the primary binding location.
Key to successful application is selecting the appropriate method for the specific drug discovery context, considering factors such as target knowledge, ligand information availability, computational resources, and required accuracy. Integration with experimental methods remains crucial for validation and refinement of computational predictions.
As the field advances, addressing challenges related to protein flexibility, generalization, and standardization will further enhance the utility of binding site identification in drug discovery. The continued development of these methods, particularly their integration with experimental workflows and downstream drug design steps, promises to accelerate the discovery of novel therapeutics for challenging disease targets.
Within the framework of computer-aided drug discovery, molecular docking serves as a pivotal technique for predicting how a small molecule ligand interacts with a biological target. The accuracy of these predictions is fundamentally contingent upon the initial preparation of the molecular system, particularly the correct assignment of protonation states and atomic partial charges [1]. These parameters directly govern the electrostatic complementarity between the ligand and the protein's binding site, a key determinant of binding affinity and specificity.
Conventional docking protocols typically assume fixed protonation states that remain unchanged between the bound and unbound states of the molecules [1]. However, this assumption is frequently invalid. Computational surveys indicate that in approximately 60% of protein-small molecule complexes, at least one titratable residue in the protein undergoes a change in protonation upon ligand binding [93]. Furthermore, an estimated 60–80% of orally administered drugs are weak acids or bases, meaning their protonation states are sensitive to the local electrostatic environment of the binding pocket [93]. The failure to account for these changes can introduce significant errors. For instance, incorrect assignment of fixed protonation states in free energy computations has been shown to produce errors exceeding 2 kcal/mol, which is substantial given that a 1.36 kcal/mol error corresponds to an order of magnitude change in binding affinity [93].
This article details the critical protocols for determining protonation states and assigning charges, positioning these steps as non-negotiable prerequisites for reliable docking studies within a broader thesis on advancing molecular docking methodologies.
Core Concepts and Quantitative Foundations
The Impact of Protonation States on Binding
The protonation state of a molecule affects its net charge, hydrogen-bonding capacity, and geometry. In proteins, residues like histidine, aspartic acid, glutamic acid, and lysine can exist in different protonated forms depending on the local pH (pH) and electrostatic environment. A ligand's protonation state is equally critical, as it influences molecular recognition.
A landmark study on cucurbit[7]uril (CB[7]) host-guest systems provides a clear quantitative demonstration of binding-induced pKa shifts. As shown in Table 1, benzimidazole derivatives experience dramatic increases in their pKa values upon encapsulation, with shifts (ΔpK) ranging from 2.5 to 4.0 units [93]. This means a ligand predominantly deprotonated in solution at physiological pH can become protonated upon binding, fundamentally altering the nature of the interaction.
Table 1: Experimental pKa Shifts of Benzimidazole Guests upon Binding to CB[7] [93]
| Guest | pKa (Free, pKaF) | pKa (Complex, pKaC) | ΔpK |
|---|---|---|---|
| BZ | 5.5 | 9.0 | 3.5 |
| TBZ | 4.6 | 8.6 | 4.0 |
| FBZ | 4.8 | 8.6 | 3.8 |
| ABZ | 3.5 | 6.1 | 2.6 |
| CBZ | 4.5 | 7.0 | 2.5 |
Charge Assignment and Force Field Dependencies
Atomic partial charges are non-integer charges assigned to atoms to represent the uneven distribution of electrons in a molecule. They are essential for accurately calculating electrostatic interactions within molecular mechanics force fields. Different docking and simulation software employ distinct charge assignment protocols [1]:
- AutoDock uses Gasteiger-Marsili charges.
- AutoDock Vina uses a charge-independent scoring function.
- DockThor assigns charges according to the MMFF94S force field.
- MolDock uses a simplified proprietary scheme.
For molecular dynamics (MD) simulations, which provide a more rigorous assessment of binding, generalized force fields like GAFF (Generalized AMBER Force Field) and CGenFF (CHARMM General Force Field) are standard [94]. Their parameterization philosophies differ: CGenFF charges aim to reproduce gas-phase QM interaction energies with a water probe, while GAFF's AM1-BCC model targets the reproduction of electrostatic surface potentials [94]. These differences can lead to systematic biases; for example, molecules with nitro-groups tend to be over-solvated in CGenFF and under-solvated in GAFF [94].
Table 2: Common Docking Software and Their Handling of Protonation/Charges [1]
| Software | Search Algorithm | Scoring Function | Protonation & Charge Handling |
|---|---|---|---|
| AutoDock Vina | Iterated Local Search | Empirical/Knowledge-Based | Charge-independent terms; user-prepares input files. |
| AutoDock4 | Genetic Algorithm | Semiempirical | Uses Gasteiger-Marsili atomic charges. |
| GOLD | Genetic Algorithm | Mixed (Physics/Empirical) | User assigns protonation states; internal charge assignment. |
| Glide | Systematic + Optimization | Empirical | Robust protein preparation workflow (e.g., Schrödinger) recommended. |
| DockThor | Genetic Algorithm | Physics-based + Empirical | Automatically generates topologies (MMFF94S force field). |
Standard Protocols for Protonation and Charge Assignment
Protocol 1: Static Preparation for Molecular Docking
This protocol is suitable for high-throughput virtual screening where computational efficiency is paramount.
Retrieve and Clean Structures:
- Obtain the 3D structure of the protein target from the PDB. For ligands, retrieve or draw 2D structures and convert them to 3D using tools like Open Babel, Corina, or the embedding functions within suites like Maestro (Schrödinger) [1].
- Remove extraneous water molecules, ions, and co-crystallized ligands not relevant to the binding event. Add missing hydrogen atoms to the protein.
Assign Initial Protonation States:
- For the Protein: Use empirical pKa prediction tools such as PROPKA or H++ to estimate the protonation state of all titratable residues at the pH of interest (typically pH 7.4) [1] [93]. Pay special attention to histidine residues, which can be protonated on the delta (HID), epsilon (HIE), or both (HIP) nitrogens. Visual inspection of the binding site hydrogen-bonding network is crucial.
- For the Ligand: Use chemical knowledge and tools like MarvinSketch or the LigPrep module (Schrödinger) to generate the most probable protonation state(s) at the target pH [95]. For molecules with ambiguous states, consider docking multiple tautomeric or protonated forms.
Assign Partial Charges and Generate Topology:
- For docking with AutoDock/Vina, use the software's tools (
prepare_receptor4.py,prepare_ligand4.py) to add Gasteiger charges and merge non-polar hydrogens. - For MD-based studies, generate ligand parameters using the antechamber or acpype tools for GAFF, or the CGenFF program for CHARMM force fields [94]. Ensure charges are fitted to a quantum-mechanically derived electrostatic potential (e.g., using the RESP method).
- For docking with AutoDock/Vina, use the software's tools (
Final Energy Minimization:
- Perform a restrained minimization of the prepared protein-ligand system. Allow hydrogen atoms to relax fully while applying mild positional restraints to protein heavy atoms to relieve any steric clashes introduced during hydrogen addition without distorting the experimental backbone geometry [95].
Diagram: Static molecular system preparation workflow for docking.
Protocol 2: Advanced Preparation with Constant pH Molecular Dynamics (CpHMD)
This protocol is used for research cases where protonation coupling is suspected, offering a dynamic alternative to static assignment [96] [97].
System Setup for CpHMD:
- Start with a pre-prepared, neutral-pH system (from Protocol 1, Step 4).
- Identify all titratable residues (Asp, Glu, His, Lys, Arg, Cys, Tyr) and the ligand. In CpHMD, these are treated with special parameters that allow protonation state changes.
Equilibration and Sampling:
- Choose a CpHMD method: discrete (hybrid MD/Monte Carlo) or continuous (λ-dynamics) [97]. The discrete method is more common and physically intuitive.
- Run an initial equilibration with protonation states fixed. Then, initiate the CpHMD simulation at the desired pH. The simulation will periodically attempt Monte Carlo steps to change the protonation state of randomly selected titratable sites based on the Metropolis criterion and the current electrostatic environment.
Analysis of Protonation Populations:
- Analyze the trajectory to determine the fractional population of each protonation state for every titratable site. A residue with a population of >0.8 for a single state can be considered reliably assigned at that pH.
- For ligands, calculate the average protonation over the simulation time. This reveals whether the ligand prefers to bind in a protonated or deprotonated state.
Generation of Representative Structures:
- Cluster the simulation trajectories based on protonation states of key binding site residues.
- Extract representative snapshots for the dominant protonation microstates to be used as separate starting points for subsequent, more rigorous binding free energy calculations (e.g., FEP, TI).
Diagram: Workflow for incorporating dynamic protonation via constant pH MD.
The Scientist's Toolkit: Essential Research Reagents & Software
Table 3: Key Software Tools for Protonation and Charge Management
| Tool Name | Type | Primary Function | Key Feature |
|---|---|---|---|
| PROPKA | Algorithm/Web Server | Predicts pKa values of amino acids in proteins. | Fast, structure-based; integrates with visualization tools [1] [93]. |
| H++ | Web Server | Determines protonation states and adds missing hydrogens via Poisson-Boltzmann calculations. | Provides full protonated PDB files ready for simulation [1] [96]. |
| Schrödinger Protein Prep Wizard | Integrated Software Suite | Automates protein preparation: adds H, assigns protonation states, optimizes H-bond networks, minimizes. | Highly automated and robust industry standard [95]. |
| AMBER/antechamber | Software Suite | Prepares ligands for MD: generates GAFF parameters, assigns AM1-BCC/RESP charges. | Standard for AMBER/OpenMM simulation workflows [96] [94]. |
| CHARMM/CGenFF | Software Suite | Parameterizes ligands for CHARMM-compatible simulations. | Consistent with CHARMM biomolecular force field philosophy [94]. |
| Open Babel | Utility | Converts chemical file formats and performs basic operations (hydrogen addition, charge assignment). | Open-source and versatile for handling ligand libraries [1]. |
| CPPTRAJ/ptraj | Analysis Tool | Analyzes MD trajectories, can calculate properties like hydrogen bonding and protonation state lifetimes. | Essential for parsing outputs of CpHMD simulations [96]. |
Application Notes: Case Studies in Best Practices
Case Study 1: The Critical Role of a Distal Histidine in Trypsin-Benzamidine Binding
Research on the trypsin-benzamidine system demonstrated that the protonation state of His57, a catalytic residue over 10 Å away from the binding pocket, critically influences binding pathways [96]. Spontaneous MD simulations showed that productive binding occurred frequently when His57 was in the neutral HID state (protonated on delta nitrogen) but was significantly hindered when it was positively charged (HIP).
- Protocol Insight: This study underscores that important protonation states are not limited to the binding site. Using a tool like H++ or PROPKA would likely assign HIP to His57 at pH 7.0. The researchers manually created systems with HID, HIE, and HIP states to explore the effect. For such sensitive systems, running short exploratory simulations with different manually assigned states for key distal residues is a recommended best practice before large-scale docking or free energy calculations [96].
Case Study 2: pH-Dependent Binding Free Energies for Host-Guest Systems
The study of CB[7] binding benzimidazole derivatives (Table 1) provided a framework for calculating pH-dependent binding free energies (ΔG°(pH)) using the Wyman binding polynomial formalism [93].
- Protocol Insight: The formula ΔG°(pH) = ΔG°ref - kT * ln( (1 + 10^(pKaC-pH)) / (1 + 10^(pKaF-pH)) ) allows calculation of binding affinity at any pH if the reference free energy (ΔG°ref, for a reaction with no net proton transfer) and the pKa values of the ligand free (pKaF) and bound (pKaC) are known. CpHMD simulations can be used to compute the often-unknown pKaC. This approach moves beyond single-state docking to provide a thermodynamic profile across pH, which is vital for drugs targeting compartments with different pH (e.g., stomach, lysosome).
Guidelines for Force Field Selection in Charge-Sensitive Contexts
Analysis of hydration free energy (HFE) errors for over 600 molecules revealed force field-specific biases [94].
- For molecules with amines: CGenFF tends to under-solvate more than GAFF. Consider this if your ligand is amine-rich and solvation/desolvation is key.
- For molecules with carboxylates: GAFF tends to over-solvate more than CGenFF.
- Best Practice: When high accuracy is required, especially for absolute binding free energy calculations, validate the force field's performance for your specific chemical scaffold by computing its HFE and comparing to experimental data if available. Employ a multi-force field approach for critical studies to assess the robustness of predictions.
Consensus Docking and Ensemble Methods to Improve Reliability
1. Introduction: Addressing Reliability in Molecular Docking Within the framework of computer-aided drug discovery (CADD), molecular docking is a cornerstone technique for predicting how small molecules interact with protein targets. However, its predictive reliability is hampered by two fundamental challenges: the inherent limitations of scoring functions and the static representation of target proteins. No single docking program is universally superior, as their performance is highly system-dependent due to differences in algorithms and scoring function parameterization [98]. Concurrently, proteins are dynamic entities, and relying on a single conformational state often fails to capture the true landscape of ligand binding [18].
This article details the integrated application of consensus docking and ensemble docking to mitigate these issues and improve the reliability of virtual screening (VS) outcomes. Consensus docking combines results from multiple docking programs to offset individual scoring function biases, thereby increasing confidence in hit identification [98] [99]. Ensemble docking incorporates the intrinsic flexibility of the target by docking ligands against a curated set of multiple protein conformations, improving the chance of capturing productive binding modes [18] [100]. When combined, these strategies form a robust protocol for enhancing the early stages of structure-based drug discovery, directly contributing to the broader thesis objective of developing more reliable and predictive CADD methodologies.
2. Quantitative Performance: Comparative Analysis of Methods The quantitative advantage of consensus and ensemble strategies is evident in key performance metrics such as Enrichment Factor (EF) and area under the receiver operating characteristic curve (ROC-AUC). Traditional consensus methods, like taking the intersection of top-ranked molecules from multiple programs, can fail if one program performs poorly [99]. Advanced methods like Exponential Consensus Ranking (ECR) address this by mathematically combining ranks from all programs, acting as a conditional "or" to rescue molecules ranked highly by only a subset of programs [99].
Table 1: Performance of Docking Programs and Consensus Strategies Across Diverse Protein Targets (EF at 2%) [99]
| Protein Target (PDB ID) | AutoDock Vina | ICM | rDock | LeDock | Traditional Consensus | Exponential Consensus (ECR) |
|---|---|---|---|---|---|---|
| CDK2 (1H1Q) | 10.5 | 22.0 | 19.5 | 17.0 | 21.0 | 24.5 |
| ESR1 (3ERT) | 5.0 | 25.0 | 20.0 | 15.0 | 22.0 | 26.5 |
| ADRB2 (3NYA) | 3.0 | 18.0 | 15.5 | 8.0 | 16.0 | 20.0 |
| CAH2 (3HS4) | 12.0 | 8.0 | 21.0 | 18.0 | 15.0 | 19.5 |
| Average Performance | 7.6 | 18.3 | 19.0 | 14.5 | 18.5 | 22.6 |
The integration of ensemble docking with machine learning (ML) further boosts predictive accuracy. A study on tyrosine-protein kinase Lck (LCK) demonstrated that combining docking scores from an ensemble of molecular dynamics (MD)-derived conformations with chemical descriptors in a K-Nearest Neighbors (KNN) model dramatically improved classification of active versus decoy compounds [100].
Table 2: Feature Categories and Performance Metrics for ML-Enhanced Ensemble Docking [100]
| Feature Category | Number of Features | Description | Impact on Model |
|---|---|---|---|
| Drug Descriptors | ~4,000 | Calculated molecular properties (e.g., logP, topological indices, functional group counts) using software like Dragon. | High; provides essential chemical context for the classifier. |
| Binding Descriptors | 109 | Individual energy terms from the docking scoring function (e.g., gauss1, hydrophobic, hydrogen bonding) for each protein conformation. | Critical; captures nuanced interaction differences between poses. |
| Protein Descriptors | 103 | Structural features (e.g., secondary structure, binding site geometry) calculated from each conformation PDB file. | Moderate; adds information on receptor state variability. |
| Model Performance | Metric: Accuracy | Result: Up to 99% accuracy in classifying actives vs. decoys was achieved when using features from the optimal protein conformation [100]. |
3. Experimental Protocols 3.1. Protocol 1: The dockECR Consensus Docking and Ranking Pipeline The dockECR protocol is an open-source workflow that implements Exponential Consensus Ranking (ECR) complemented by pose conservation analysis [101].
Procedure:
- Input Preparation:
- Protein Preparation: Obtain the 3D structure of the target protein (e.g., from PDB, AlphaFold, or a homology model). Prepare the structure using a tool like UCSF Chimera or Schrodinger's Protein Preparation Wizard: add hydrogen atoms, assign protonation states, and optimize side-chain orientations.
- Ligand Library Preparation: Prepare a library of small molecules in a standard format (e.g., SDF, MOL2). Generate plausible 3D conformations and assign correct charges (e.g., using Open Babel or OMEGA).
Parallel Docking Execution: Dock the prepared ligand library against the prepared protein target using four distinct open-source docking programs:
- AutoDock Vina and its derivative Smina (empirical scoring).
- rDock (genetic algorithm search, energetic scoring).
- LeDock (simulated annealing search, empirical scoring).
- Configuration: Define a consistent binding site region for all programs using a grid box centered on the known binding pocket.
Result Parsing and Ranking: For each docking program, extract the best docking score (or pose energy) for every molecule. Rank all molecules within each program from best (rank 1) to worst.
Exponential Consensus Ranking (ECR) Calculation:
- For each molecule i, calculate its ECR score using the formula from [99]:
P(i) = (1/σ) * Σ_j exp(-r_i^j / σ), wherer_i^jis the rank of molecule i in program j, andσis a sensitivity parameter (often set to 1% of the library size). - Sum the exponential terms across all four programs (
j). Generate a final consensus ranked list by sorting molecules by their descendingP(i)score.
- For each molecule i, calculate its ECR score using the formula from [99]:
Pose Conservation Analysis (Optional):
- For the top-ranked consensus molecules, compare the predicted binding poses from each of the four programs.
- Calculate the average Root-Mean-Square Deviation (RMSD) between the geometric centers of these poses. A low average RMSD suggests high pose consensus, adding confidence to the predicted binding mode [101].
Hit Prioritization: Prioritize molecules that appear in the top tier of the ECR-ranked list and, if available, demonstrate high pose conservation.
3.2. Protocol 2: Ensemble Docking with MD and Machine Learning This protocol integrates molecular dynamics, ensemble docking, and machine learning to account for full protein flexibility and improve prediction accuracy [100].
Procedure:
- Conformational Ensemble Generation:
- Starting from a crystal structure or a high-quality model, run an all-atom molecular dynamics (MD) simulation of the apo protein (without ligand) in explicit solvent using software like GROMACS or AMBER.
- Ensure the simulation length is sufficient to capture relevant binding site dynamics (typically hundreds of nanoseconds).
- Cluster the MD trajectory based on the root-mean-square deviation (RMSD) of binding site residues. Select representative snapshot structures from the largest clusters to form the docking ensemble.
Ensemble Docking:
- Dock the entire ligand library (including known actives and decoys) into each protein conformation in the ensemble using a preferred docking program (e.g., AutoDock Vina).
- For each ligand, record the best docking score from each conformation.
Feature Engineering:
- Ligand Features: Calculate a set of molecular descriptors (e.g., molecular weight, logP, topological polar surface area) for all compounds.
- Docking Features: For each ligand-conformation combination, extract the individual components of the docking score (e.g., van der Waals, hydrogen bonding, electrostatic terms).
- Protein Features (Optional): Calculate structural features for each conformation (e.g., binding pocket volume, residue angles).
- Labeling: Label each data point (ligand + conformation features) as "active" or "decoy" based on experimental data.
Model Training and Validation:
- Assemble all features into a unified dataset. Use a feature selection method (e.g., random forest importance) to identify the most predictive descriptors.
- Train a supervised machine learning classifier (e.g., Random Forest, K-Nearest Neighbors) to distinguish actives from decoys based on the combined feature set.
- Validate the model using rigorous cross-validation, holding out a subset of the data not used in training.
Prospective Screening:
- Apply the trained model to score and rank new, unseen compounds. The model's prediction probability or score provides a robust, meta-score for hit prioritization that integrates conformational and chemical information.
4. The Scientist's Toolkit: Essential Research Reagents and Resources
Table 3: Key Software, Databases, and Resources for Consensus and Ensemble Docking
| Resource Name | Type | Primary Function in Protocol |
|---|---|---|
| DUD-E Database | Database | Provides benchmark sets of known active molecules and property-matched decoys for validating virtual screening methods [100]. |
| AlphaFold DB | Database | Source of high-accuracy predicted protein structures for targets lacking experimental 3D models [98]. |
| CHARMM-GUI | Web Server | Prepares complex molecular systems (e.g., membrane proteins in lipid bilayers) for MD simulations [98]. |
| AutoDock Vina/Smina | Docking Software | Open-source programs for molecular docking and scoring; commonly used in consensus protocols [99] [101]. |
| GROMACS/AMBER | MD Software | Suites for running molecular dynamics simulations to generate conformational ensembles [100]. |
| RDKit | Cheminformatics | Open-source toolkit for calculating molecular descriptors and handling chemical data, essential for feature engineering [100]. |
| scikit-learn | ML Library | Python library providing algorithms (e.g., RandomForest, KNN) for building classification models on docking/descriptor data [100]. |
| dockECR | Code Protocol | Open-source Python implementation of the Exponential Consensus Ranking protocol [101]. |
5. Future Perspectives and Conclusion The convergence of consensus docking, ensemble methods, and machine learning represents a significant advance toward more reliable CADD pipelines. Future developments are likely to focus on the seamless integration of ultra-large library screening (>1 billion molecules) with these robust scoring methodologies [74]. Furthermore, the rapid generation of accurate protein structures via AI (AlphaFold) and cryo-EM provides an ever-expanding repertoire of targets and conformational states for ensemble-based discovery [98] [102]. The protocols detailed herein provide a practical framework for researchers to implement these synergistic techniques, directly contributing to the overarching goal of reducing attrition in early drug discovery by improving the predictive fidelity of molecular docking.
Computational Resource Optimization for Large-Scale Virtual Screening
This document presents detailed application notes and protocols for the computational resource optimization essential for conducting large-scale virtual screening (VS) campaigns. This work is framed within a broader thesis on computer-aided drug discovery (CADD) molecular docking methods, which are critical for reducing the time and cost associated with traditional drug development [103]. The integration of artificial intelligence (AI) and machine learning with established physics-based docking methods represents a paradigm shift, enabling the screening of ultra-large, multi-billion compound libraries that were previously considered computationally intractable [51] [104].
The core challenge addressed here is the efficient and accurate navigation of an expansive chemical space to identify novel hit compounds against therapeutic targets. Traditional high-throughput screening (HTS) is often limited by cost, logistics, and low hit rates. In contrast, structure-based virtual screening (SBVS) uses the three-dimensional structure of a target protein to computationally prioritize compounds for experimental testing, dramatically increasing efficiency [103] [105]. However, as libraries grow to billions of molecules, even sophisticated docking programs require immense computational resources. Therefore, optimizing these resources through strategic pre-filtering, hierarchical screening protocols, and AI-accelerated active learning is not merely an engineering concern but a fundamental requirement for the next generation of CADD research [104].
Key Methodologies and Quantitative Benchmarks
The success of a virtual screening campaign hinges on the accuracy of the scoring functions and docking protocols used to predict protein-ligand interactions [103]. Performance is quantitatively evaluated using standardized benchmark datasets that allow for the comparison of different methods.
Performance of State-of-the-Art Virtual Screening Methods
The following table summarizes the performance of leading virtual screening methods on key benchmark datasets, highlighting the advancements in physics-based and AI-integrated approaches.
Table 1: Performance Comparison of Virtual Screening Methods on Standard Benchmarks [104] [106].
| Method / Software | Type | Key Benchmark (Dataset) | Performance Metric | Reported Result | Key Advantage |
|---|---|---|---|---|---|
| RosettaVS (VSH Mode) | Physics-based Docking (Flexible Receptor) | DUD-E (40 targets) | AUC (Median) | 0.87 | Models side-chain & limited backbone flexibility |
| RosettaVS (VSX Mode) | Physics-based Docking (Fast) | DUD-E (40 targets) | AUC (Median) | 0.78 | High-speed initial triage |
| Glide (SP Mode) | Physics-based Docking | CASF-2016 (285 complexes) | Top 1% Enrichment Factor (EF1%) | 11.90 | Widely used, high accuracy |
| AutoDock Vina | Physics-based Docking | CASF-2016 | Top 1% Enrichment Factor (EF1%) | ~8.50 | Popular freeware option |
| RosettaGenFF-VS | Improved Physics-based Scoring | CASF-2016 | Top 1% Enrichment Factor (EF1%) | 16.72 | Combined enthalpy/entropy model |
| AI-Accelerated Active Learning | Hybrid AI/Physics | Ultra-large Library (>1B cmpds) | Hit Rate vs. Resource Use | 10-100x Speedup | Dramatically reduces required docking calculations |
Essential Datasets for Training and Validation
High-quality, curated datasets are indispensable for developing, validating, and benchmarking VS protocols. The table below catalogs primary public data sources.
Table 2: Essential Public Data Sources for Virtual Screening Development and Validation [106].
| Database Name | Primary Content | Size (Approx.) | Key Use in VS | Access |
|---|---|---|---|---|
| PDBbind | Curated protein-ligand complexes with binding affinity data | 21,382 complexes (v.2019) | Scoring function training & testing; Core set (285 complexes) for benchmarking | Public |
| ChEMBL | Bioactivity data (IC50, Ki, etc.) for drug-like molecules | 17M+ activities, 14K+ targets | Building ligand-based models, activity prediction | Public |
| PubChem BioAssay | Biological screening results and compound information | 280M+ bioactivity points | Source of active/inactive compounds for training | Public |
| BindingDB | Measured binding affinities for protein-ligand pairs | 2.2M+ data points | Validation of docking poses and affinity predictions | Public |
| ZINC | Commercially available compounds for virtual screening | 100M - 1B+ molecules | Source of purchasable compounds for screening libraries | Public |
| DUD-E / DUD | Benchmark sets with actives and property-matched decoys | 102 targets / 40 targets | Evaluating VS power and avoiding false positives | Public |
Core Optimization Strategies for Large-Scale Campaigns
Optimization strategies focus on minimizing unnecessary computational expense while maximizing the probability of identifying true bioactive hits.
Hierarchical Workflow with Multi-Stage Filtering
A tiered filtering approach is the most effective strategy for managing resources. This workflow integrates ligand-based pre-screening, rapid preliminary docking, and high-accuracy refinement.
Diagram 1: Hierarchical Virtual Screening Workflow
AI-Accelerated Active Learning
Active learning frameworks, such as the OpenVS platform [104], address the core resource problem by iteratively training a target-specific machine learning model to predict the outcome of expensive docking calculations. The process is as follows:
- A small, random subset of the library (e.g., 0.1%) is docked using a fast method.
- The results (features and scores) train a neural network to distinguish between high-scoring and low-scoring compounds.
- The model predicts scores for the undocked portion of the library and selects the most promising batch for the next round of docking.
- Steps 2-3 repeat, with the model improving each cycle, allowing the discovery of >90% of top-scoring hits by docking <5% of the total library [104].
Detailed Experimental Protocol: Targeting an Undruggable Protein
The following protocol, adapted from a recent large-scale screening campaign for TIMP2 modulators [107], provides a reproducible template for resource-optimized screening against challenging targets.
Protocol: Large-Scale Virtual Screening for Allosteric Modulators
Aim: To identify novel small-molecule modulators of TIMP2 by screening a 500,000+ compound library against predicted allosteric sites in under seven days using a moderate HPC cluster.
Materials & Software:
- Target Structure: TIMP2 homology model or crystal structure (PDB ID).
- Compound Library: CNS-filtered subset of the ZINC20 database [107].
- Software: Docking software (e.g., AutoDock Vina, RosettaVS); Pipeline scripting (Python/bash); Visualization (PyMOL); ADMET prediction tools (e.g., ProTox-III, admetSAR).
Procedure:
Step 1: Target and Binding Site Preparation (Day 1)
- Obtain the 3D structure of TIMP2. If an experimental structure is unavailable, generate a high-confidence homology model [103].
- Using literature and computational cavity detection (e.g., FTMap, SiteMap), define the coordinates of at least two putative allosteric sites (e.g., the canonical MMP-2 interaction surface and a cryptic cleft).
- Prepare the target protein file: add polar hydrogens, assign partial charges, and define flexible residue side chains for the high-precision docking stage.
Step 2: Library Curation and Pre-Filtering (Day 1)
- Download a pre-filtered library (e.g., "drug-like" or "CNS" subset) from ZINC.
- Apply additional in-house filters using tools like
OpenBabelorRDKit:- Remove compounds violating more than one Lipinski's Rule of Five.
- Filter for desired physicochemical properties (e.g., molecular weight <450, logP <5).
- Apply a structural filter to remove potential pan-assay interference compounds (PAINS).
- Convert the final library (approx. 500,000 compounds) to the required 3D format (e.g., SDF) and minimize energies using a molecular mechanics force field.
Step 3: High-Throughput Docking Phase (Days 2-4)
- Use the fast docking (VSX) mode of your chosen software. Configure the job to use a large search space encompassing all identified sites if performing "blind" allosteric screening, or separate, defined boxes for each site.
- Parallelize the docking of the 500,000 compounds across an HPC cluster. For example, using 500 CPU cores, split the library into 500 batches of 1,000 compounds each.
- Collect all output poses and scores. Retain the top 50,000 compounds (top 10%) based on the docking score for further analysis.
Step 4: Pose Analysis and Diversity Selection (Day 5)
- Cluster the top poses from Step 3 based on their structural orientation (RMSD) within the binding site.
- Select a representative subset of 5,000 compounds that maximizes chemical and pose diversity. This ensures broad coverage of the chemical space and binding modes.
Step 5: High-Precision Re-Docking (Day 6)
- Dock the 5,000 diverse compounds using the high-precision (VSH) mode, which includes full side-chain flexibility and a more exhaustive search algorithm.
- Re-score the resulting poses using a more accurate, possibly consensus, scoring function.
- Generate a new ranked list based on this refined score.
Step 6: Post-Docking Filtering and Prioritization (Day 7)
- Subject the top 1,000 compounds from Step 5 to in silico ADMET and toxicity prediction (e.g., using ProTox-III for cytotoxicity and admetSAR for absorption parameters).
- Manually inspect the top 100-200 compounds. Prioritize those with:
- Favorable binding poses forming specific hydrogen bonds or hydrophobic interactions.
- Clean ADMET profiles.
- Novel chemical scaffolds not previously reported for the target.
- Generate a final list of 30-50 top-priority compounds for purchase and experimental validation.
The Scientist's Toolkit: Research Reagent Solutions
The following table details essential computational "reagents" — software, databases, and hardware resources — required to execute optimized large-scale virtual screening.
Table 3: Essential Research Reagent Solutions for Large-Scale Virtual Screening.
| Item Category | Specific Tool / Resource | Function / Purpose | Key Characteristics |
|---|---|---|---|
| Docking & Scoring Software | RosettaVS (OpenVS Platform) [104] | High-accuracy flexible receptor docking & AI-accelerated screening | Open-source, VSX/VSH modes, integrated active learning. |
| AutoDock Vina [104] [106] | Standard rapid docking for initial screening. | Fast, free, widely used, good for initial triage. | |
| Schrödinger Glide [104] | High-performance precision docking and scoring. | Industry standard, high accuracy, commercial license. | |
| Compound Libraries | ZINC [107] [106] | Source of commercially available compounds for screening. | Hundreds of millions of molecules, easily filterable, purchase links. |
| Enamine REAL / MCULE | Ultra-large libraries for in silico screening (billions). | Enormous chemical space, often used with generative models. | |
| Data & Benchmarking | PDBbind [106] | Curated set of protein-ligand complexes with binding affinities. | Essential for training and testing custom scoring functions. |
| DUD-E [104] [106] | Benchmark set with actives and decoys. | Critical for validating the screening power of a protocol. | |
| Pre-/Post-Processing | RDKit | Open-source cheminformatics toolkit. | Library standardization, descriptor calculation, fingerprinting. |
| ProTox-III / admetSAR | Web servers for toxicity and ADMET property prediction. | Filters out compounds with poor predicted safety profiles. | |
| Computational Hardware | HPC Cluster (CPU) | Core resource for parallelizing docking jobs. | Thousands of cores allow screening millions of compounds in days. |
| GPU Accelerators (NVIDIA) | Accelerates ML training and inference in active learning loops. | Critical for AI-accelerated platforms like OpenVS. |
Benchmarking Docking Performance and Integrating Experimental Validation
Standardized Benchmarking Sets and Performance Metrics for Docking Accuracy
Within the broader thesis on advancing computer-aided drug discovery (CADD) molecular docking methods, the establishment of rigorous and standardized benchmarking is paramount [62]. Molecular docking is a cornerstone of structure-based drug design, but its predictive accuracy must be reliably quantified to guide tool selection and methodological development [16]. This article provides detailed application notes and protocols for evaluating docking accuracy, framed by the urgent need—akin to the historic Critical Assessment of Structure Prediction (CASP) for protein folding—for sustained community benchmarking in small-molecule pose and activity prediction [108]. The proliferation of traditional and, more recently, deep learning (DL)-based docking methods has made objective evaluation more critical and complex [16] [12]. Effective benchmarking requires curated datasets that separate active compounds from decoys, standardized performance metrics, and protocols that reflect real-world discovery scenarios, such as virtual screening (VS) and lead optimization (LO) [109] [110]. This document details the essential benchmarking sets, key metrics, and experimental protocols to empower researchers to critically assess and enhance the accuracy of molecular docking in their drug discovery pipelines.
Core Benchmarking Sets and Performance Metrics
Selecting appropriate benchmark sets and metrics is fundamental for a meaningful evaluation. The ideal benchmark set contains high-quality protein-ligand complexes with verified bioactive molecules and carefully designed, property-matched decoys to challenge the docking algorithm's ability to discriminate.
Standardized Benchmarking Datasets
The following table summarizes key publicly available benchmarking sets, highlighting their composition, primary use, and distinguishing characteristics.
Table 1: Standardized Benchmarking Sets for Docking and Virtual Screening
| Benchmark Set | Primary Use | Key Characteristics & Composition | Notable Applications |
|---|---|---|---|
| DEKOIS 2.0 [109] | Virtual Screening (VS) Evaluation | Contains 81 protein targets. For each, provides known active ligands and property-matched decoys (typically 30 decoys per active). Focuses on "difficult" decoys to minimize false enrichments. | Benchmarking docking tools (AutoDock Vina, PLANTS, FRED) and ML rescoring functions for targets like PfDHFR [109]. |
| PDBbind [16] [3] | Binding Pose & Affinity Prediction | A hierarchical database: "General Set" (~23k complexes), "Refined Set" (~5.5k, higher quality), "Core Set" (~300, non-redundant). Provides 3D structures with binding affinity data (Kd, Ki, IC50). | The "Core Set" is the primary test set for the CASF benchmark for scoring functions. Used to train and evaluate DL docking models [16] [3]. |
| CARA (Compound Activity benchmark for Real-world Applications) [110] | Compound Activity Prediction | Distinguishes between VS assays (diffused compound patterns) and LO assays (congeneric compounds). Built from ChEMBL, reflecting sparse, unbalanced, multi-source real-world data. | Evaluates model performance in practical VS and LO scenarios, including few-shot and zero-shot learning tasks [110]. |
| Astex Diverse Set [16] | Binding Pose Prediction (Re-docking) | A curated set of 85 high-quality protein-ligand crystal structures. Used to test a method's ability to re-dock a ligand into its native receptor structure. | Commonly used to evaluate baseline pose prediction accuracy of traditional and DL docking methods [16]. |
| PoseBusters Benchmark Set [16] | Physical Validity & Generalization | Contains complexes not used in training major DL models. Includes a "PB-valid" metric to check for chemical and geometric inconsistencies (bond lengths, steric clashes). | Reveals if DL methods produce physically plausible poses on unseen data, beyond just low RMSD [16]. |
Quantitative Performance Metrics
Docking performance is measured through metrics that evaluate both the geometric accuracy of predicted poses and the success in practical screening tasks.
Table 2: Key Performance Metrics for Docking Accuracy and Virtual Screening
| Metric Category | Specific Metric | Formula/Definition | Interpretation & Relevance |
|---|---|---|---|
| Pose Accuracy | Root-Mean-Square Deviation (RMSD) | RMSD = √[ Σ(atompositionpred - atompositioncrystal)² / N ] | Measures geometric deviation of predicted ligand pose from experimental crystal structure. A pose with RMSD ≤ 2.0 Å is typically considered a successful prediction [16]. |
| Screening Enrichment | Enrichment Factor at 1% (EF1%) | EF1% = (Hitssampled / Nsampled) / (Hitstotal / Ntotal). Hitssampled is the number of true actives found in the top 1% of the ranked library. | Quantifies early enrichment capability. Higher EF1% indicates better prioritization of actives early in a ranked list, crucial for VS efficiency [109]. |
| Screening Enrichment | Area Under the ROC Curve (AUC-ROC) | Plots True Positive Rate vs. False Positive Rate across all ranking thresholds. The area under this curve. | Measures overall ability to discriminate between active and inactive/decoys across all thresholds. An AUC > 0.5 indicates performance better than random. |
| Pose Validity | PB-Valid Rate [16] | Percentage of predicted poses that pass all chemical and geometric checks in the PoseBusters toolkit (e.g., valid bond lengths, no steric clashes). | Critical for DL methods, which may generate low-RMSD but physically impossible structures. A high PB-valid rate ensures predictions are chemically realistic [16]. |
| Success Rate | Combined Success Rate [16] | Percentage of docking cases where a method achieves both RMSD ≤ 2.0 Å and a PB-valid pose. | A holistic metric balancing geometric accuracy and physical plausibility, representing the fraction of truly usable predictions. |
Experimental Protocols for Benchmarking Docking Accuracy
This section provides detailed, stepwise protocols for two critical benchmarking experiments: evaluating virtual screening performance and assessing binding pose prediction accuracy.
Protocol 1: Benchmarking Virtual Screening Performance with DEKOIS 2.0
This protocol outlines the process for evaluating a docking tool's ability to enrich active compounds from a pool of decoys, as demonstrated in studies on Plasmodium falciparum dihydrofolate reductase (PfDHFR) [109].
Objective: To determine the virtual screening enrichment performance of a docking tool (e.g., AutoDock Vina, FRED, PLANTS) and/or a machine learning rescoring function (e.g., CNN-Score, RF-Score-VS) for a specific protein target.
Materials & Software:
- Protein Structure: PDB files for the target (e.g., PfDHFR wild-type: 6A2M; quadruple-mutant: 6KP2) [109].
- Benchmark Set: DEKOIS 2.0 library for the target, containing SDF files for known actives and decoys [109].
- Docking Software: The tool(s) to be evaluated (e.g., AutoDock Vina 1.5.7).
- Scripting Tools: Python/R scripts for analysis, OpenBabel for file format conversion [109].
Procedure:
- Protein Preparation:
- Download the PDB file. Remove water molecules, ions, and irrelevant chains.
- Add hydrogen atoms and optimize their placement using a tool like
prepare_receptor4.pyfrom MGLTools or OpenEye's "Make Receptor" [109]. - Define the binding site grid box coordinates and dimensions based on the cognate ligand's location.
Ligand Library Preparation:
- Convert all actives and decoys from SDF to the required input format (e.g., PDBQT for AutoDock Vina) using OpenBabel [109].
- For tools requiring it, generate multiple conformers for each ligand (e.g., using OMEGA).
Docking Execution:
- Dock every compound (actives + decoys) into the prepared protein structure using the defined grid box.
- Standardize parameters (e.g., exhaustiveness for Vina) across all runs. Save the top-ranked pose and its docking score for each compound.
Rescoring (Optional but Recommended):
- Extract the top poses generated by the docking tool.
- Process these poses through a pretrained machine learning scoring function (MLSF) like CNN-Score or RF-Score-VS v2 to obtain a new ranking [109].
Performance Analysis:
- Rank the entire library from best to worst based on the docking score (or MLSF score).
- Calculate EF1% and AUC-ROC by comparing the ranking of known actives against decoys.
- Generate a pROC-Chemotype plot to visualize early enrichment and the chemotype diversity of retrieved actives [109].
Interpretation: The docking tool (or tool+MLSF combination) with the highest EF1% and AUC-ROC demonstrates superior screening utility for that target. Studies show that MLSF rescoring often significantly improves enrichment over classical scoring functions alone, especially for challenging targets like drug-resistant mutants [109].
Protocol 2: Multidimensional Evaluation of Binding Pose Prediction
This protocol, derived from comprehensive evaluations of traditional and DL-based methods, assesses pose accuracy, physical validity, and interaction recovery across diverse test sets [16].
Objective: To perform a holistic evaluation of a docking method's performance across multiple dimensions: geometric accuracy (RMSD), physical plausibility, and recovery of key interactions.
Materials & Software:
- Benchmark Datasets: Astex Diverse Set (re-docking), PoseBusters Set (generalization), DockGen Set (novel pockets) [16].
- Docking Methods: A selection to compare (e.g., traditional: Glide SP, AutoDock Vina; DL-based: SurfDock, DiffBindFR).
- Validation Tools: PoseBusters toolkit for physical validation [16].
- Analysis Software: VMD/PyMOL for visual inspection, custom scripts for RMSD calculation.
Procedure:
- Dataset Curation & Splitting:
- Ensure a strict separation between complexes used in the training of any DL method and those used in this test. The PoseBusters set is designed for this purpose [16].
- For novel pocket evaluation, use the DockGen dataset.
Pose Prediction:
- For each complex in each dataset, run the docking method to generate the top-ranked pose. For blind docking methods, note the predicted binding site location.
Geometric Accuracy Calculation:
- Align the predicted ligand pose to the crystallographic ligand pose using the protein's alpha carbons.
- Calculate the heavy-atom RMSD. Record a success if RMSD ≤ 2.0 Å.
Physical Validity Check:
- Process the predicted pose through the PoseBusters validation suite [16].
- Record whether the pose is "PB-valid" (passes all chemical realism checks).
Interaction Fingerprint Analysis:
- Generate an interaction fingerprint (e.g., using PLIP or Schrödinger's tools) for both the crystal pose and the predicted pose.
- Calculate the similarity (e.g., Tanimoto coefficient) between the two fingerprints to quantify critical interaction recovery.
Composite Scoring:
- Compute the Combined Success Rate: the percentage of cases where a prediction is both RMSD ≤ 2.0 Å and PB-valid [16].
- Stratify results by dataset (Astex, PoseBusters, DockGen) to assess generalization.
Interpretation: This multidimensional analysis reveals key strengths and weaknesses. For example, traditional methods (Glide SP) often excel in physical validity, while generative diffusion models (SurfDock) may lead in raw RMSD accuracy but suffer from lower physical validity rates [16]. The Combined Success Rate is the most stringent and practical metric for overall performance.
Visual Schematics of Benchmarking Workflows
Figure 1: Standardized Workflow for Virtual Screening Benchmarking. The process begins with input data preparation, proceeds through docking and optional machine learning rescoring, and concludes with quantitative performance evaluation [109] [110].
Figure 2: Multidimensional Framework for Docking Method Evaluation. Modern docking tools must be assessed across multiple datasets and performance dimensions, with the Combined Success Rate providing a holistic measure of practical utility [16].
Table 3: Essential Research Reagents and Resources for Docking Benchmarking
| Resource Name | Type | Primary Function in Benchmarking | Key Features / Notes |
|---|---|---|---|
| DEKOIS 2.0 [109] | Benchmark Database | Provides targets with verified actives and challenging property-matched decoys to evaluate virtual screening enrichment. | Contains 81 protein targets. Critical for calculating EF1% and avoiding artificially high performance from "easy" decoys. |
| PDBbind & CASF Core Set [16] [3] | Benchmark Database | Provides a curated, non-redundant set of high-quality protein-ligand complexes with binding data for pose and affinity prediction tests. | The standard set for training and testing scoring functions. The "Core Set" is used for the CASF benchmark. |
| PoseBusters Toolkit [16] | Validation Software | Checks predicted ligand poses for chemical and geometric errors (bad bond lengths, steric clashes, incorrect stereochemistry). | Essential for evaluating the physical realism of poses, especially those generated by DL models which may have low RMSD but invalid chemistry. |
| CNN-Score / RF-Score-VS v2 [109] | Machine Learning Scoring Function (MLSF) | Re-ranks docking poses to improve the discrimination between active and inactive compounds, boosting early enrichment (EF1%). | Pretrained MLSFs can be applied post-docking to significantly improve virtual screening performance without retraining [109]. |
| AutoDock Vina, PLANTS, FRED [109] | Traditional Docking Software | Standard molecular docking tools used as baselines for comparison against newer methods. Provide initial poses and scores for rescoring. | Well-established, widely used tools. Their performance on benchmarks like DEKOIS 2.0 is a common reference point. |
| ChEMBL Database [110] [3] | Bioactivity Repository | Source of experimental bioactivity data for constructing realistic benchmark sets like CARA that reflect real-world data distributions. | Contains over 24 million bioactivity records. Allows separation of VS-type (diverse) and LO-type (congeneric) assay data [110]. |
Within the paradigm of computer-aided drug discovery (CADD), structure-based molecular docking serves as a foundational computational technique for predicting how small molecule ligands interact with target macromolecules, facilitating lead discovery and optimization [1]. The traditional docking paradigm, operational for decades, is built on a search-and-score framework. It employs algorithmic sampling of ligand conformational space within a (often rigid) protein binding site, followed by ranking poses using physics-based or empirical scoring functions [111]. While automated and powerful, this approach contends with intrinsic trade-offs between computational cost and accuracy, and often struggles with modeling full receptor flexibility and achieving high fidelity in binding affinity prediction [12].
The convergence of CADD with artificial intelligence (AI), particularly deep learning (DL), is instigating a methodological shift [51]. AI-enhanced docking leverages neural networks to learn complex patterns from vast datasets of known protein-ligand complexes. These methods can either replace the traditional search algorithm (e.g., using diffusion models to generate poses), augment the scoring function, or create end-to-end prediction pipelines [16]. The core thesis of this evolution posits that AI integration can transcend traditional limitations, offering superior speed, pose accuracy, and screening efficacy, albeit introducing new challenges related to generalizability, physical realism, and interpretability [16] [12].
This article provides a detailed comparative analysis and practical protocols, contextualized within ongoing CADD research, to guide researchers in selecting and implementing appropriate docking methodologies for their drug discovery campaigns.
Core Comparative Analysis: Performance Metrics and Methodologies
A multidimensional evaluation reveals distinct performance profiles for traditional, AI-native, and hybrid docking methods. Key metrics include pose prediction accuracy (often measured by Root-Mean-Square Deviation, RMSD ≤ 2.0 Å), physical validity (assessing stereochemistry, bond lengths, and clash avoidance), and virtual screening (VS) enrichment for identifying true binders from decoys [16].
Table 1: Performance Comparison of Docking Methodologies Across Benchmark Datasets [16]
| Method Category | Example Software/Model | Pose Accuracy (RMSD ≤ 2Å) | Physical Validity (PB-Valid Rate) | Combined Success (RMSD ≤ 2Å & PB-Valid) | Key Characteristics & Best Use Context |
|---|---|---|---|---|---|
| Traditional Physics-Based | Glide SP (Commercial) | High (~75-85%) | Very High (>94%) | High (~74-82%) | Excellent physical realism and reliability for standard docking with known pockets. High computational cost for high-throughput. |
| AutoDock Vina (Free) | Moderate to High | High | Moderate to High | Widely accessible, good balance of speed and accuracy for routine tasks. | |
| AI-Generative (Diffusion) | SurfDock | Very High (>75-91%) | Moderate (~40-63%) | Moderate (~33-61%) | Excellent pose generation, especially for novel pockets. May produce steric clashes. Ideal for initial pose sampling. |
| DiffDock [12] | High | Moderate | Moderate | State-of-the-art blind docking; fast inference. | |
| AI-Regression Based | KarmaDock, QuickBind | Low to Moderate | Low (<35%) | Low | Fast but often produces chemically invalid geometries. Not recommended for final pose prediction. |
| Hybrid (AI-Score + Traditional Search) | Interformer [16] | High | High | High | Balances AI-enhanced scoring accuracy with robust conformational search. Promising for high-quality virtual screening. |
| AI-Accelerated Platform | RosettaVS (OpenVS) [104] | State-of-the-Art | High | State-of-the-Art | Integrates active learning, high-performance computing, and flexible receptor modeling for ultra-large-scale VS. |
Interpretation of Comparative Data: The data underscores a fundamental trade-off. Traditional methods, particularly commercial packages like Glide, excel in producing physically plausible results due to their grounded physics-based or highly refined empirical scoring functions [16]. In contrast, generative AI models like SurfDock achieve top-tier pose accuracy by learning from data but can generate poses with minor steric violations [16]. The most significant practical advancement may come from hybrid approaches (like Interformer) and integrated platforms (like OpenVS), which synergize AI's pattern recognition with the rigorous sampling and physical constraints of traditional methods, thereby delivering robust performance suitable for demanding virtual screening campaigns [16] [104].
Traditional Molecular Docking Workflow
AI-Enhanced Docking Process
Application Notes and Detailed Protocols
The following protocols are designed for researchers to execute standard and AI-enhanced docking workflows, highlighting critical steps for success.
Application Note 1: Protocol for Traditional Semi-Flexible Docking Using AutoDock Vina
This protocol is ideal for standard docking simulations where the protein binding site is well-defined [1] [111].
System Preparation:
- Protein: Obtain the 3D structure (PDB format). Remove water molecules, co-crystallized ligands, and add polar hydrogens. Assign correct protonation states for key residues (e.g., His, Asp, Glu) using tools like
propkaorH++[1]. - Ligand: Obtain or draw the 2D/3D structure. Generate probable 3D conformers and optimize geometry using tools like Open Babel or RDKit. Determine the correct protonation state at physiological pH.
- Protein: Obtain the 3D structure (PDB format). Remove water molecules, co-crystallized ligands, and add polar hydrogens. Assign correct protonation states for key residues (e.g., His, Asp, Glu) using tools like
Grid Box Generation:
- Define the search space. If the binding site is known from a co-crystallized ligand, center the grid box on it. Use coordinates and dimensions (e.g., 20x20x20 Å) to encompass the active site fully. Tools like AutoDock Tools or UCSF Chimera facilitate this step.
Configuration and Execution:
- Create a configuration file (
conf.txt) specifying the receptor, ligand, grid center/size, and exhaustiveness (controls search depth; increase for accuracy, default=8). - Execute Vina via command line:
vina --config conf.txt --log output.log.
- Create a configuration file (
Post-Processing and Analysis:
- The output generates multiple poses ranked by predicted binding affinity (in kcal/mol). Analyze the top poses for key interactions (H-bonds, hydrophobic contacts, pi-stacking). Visually inspect poses in molecular viewers like PyMOL or Chimera. Compute RMSD against a known reference pose, if available, to validate accuracy.
Application Note 2: Protocol for AI-Enhanced Docking Using a Diffusion Model (DiffDock)
This protocol leverages a state-of-the-art generative model for blind or flexible docking tasks where traditional search may be inefficient [12].
Input Preparation for AI Models:
- Protein: Provide a clean PDB file. AI models are typically less sensitive to minor protonation issues than force fields but ensure the structure is reasonable. No predefined binding site box is needed for blind docking.
- Ligand: Provide ligand in a standard format (SDF, MOL2). The model processes the ligand's graph representation.
Model Inference:
- Load the pre-trained DiffDock model (available from GitHub repositories). The model uses an SE(3)-Equivariant Graph Neural Network to apply a diffusion process, iteratively denoising a random initial guess into a final pose [12].
- Run inference by feeding the protein and ligand structures. Specify the number of output samples (e.g., 40 predictions). Execution is typically fast (seconds to minutes per ligand) on a GPU.
Pose Filtering and Validation:
- DiffDock outputs poses with associated confidence scores. Critical Step: Filter poses using a toolkit like PoseBusters to check for chemical and geometric validity (bond lengths, angles, steric clashes) [16]. AI-generated poses may have high accuracy (low RMSD) but occasional physical imperfections.
Optional Refinement:
- Refine the top AI-generated poses using a quick molecular mechanics (MM) minimization or short MD simulation with constraints. This step alleviates minor clashes and optimizes interactions without deviating from the predicted binding mode.
Application Note 3: Protocol for Hybrid AI-Physics Virtual Screening (RosettaVS/OpenVS)
This protocol describes a high-performance virtual screening workflow combining active learning, AI pre-screening, and precise physics-based docking [104].
Platform Setup and Library Preparation:
- Deploy the OpenVS platform on an HPC cluster. Prepare the target protein structure, allowing for flexible sidechains in the binding site. Curate the ultra-large ligand library (e.g., in SDF format).
Active Learning-Guided Screening Cycle:
- Phase 1 - Express Screening (VSX): Use a fast, simplified scoring function to dock and score a large random subset (e.g., 1 million compounds) from the library [104].
- Phase 2 - Model Training: Train a target-specific neural network on the fly using the results from Phase 1. This model learns to predict the likelihood of a compound being a high-scoring hit.
- Phase 3 - AI-Guided Selection: The trained model iteratively selects the most promising batches of unscreened compounds from the vast library for subsequent docking, dramatically increasing efficiency.
High-Precision Docking and Ranking:
- The top hits identified from the active learning cycle are subjected to a high-precision docking mode (VSH). This mode uses the full RosettaGenFF-VS scoring function, which includes sophisticated terms for enthalpy and entropy, and allows for full receptor sidechain flexibility [104].
Hit Analysis and Validation:
- Analyze the final ranked list. The top 100-500 compounds constitute the virtual hits. Perform cluster analysis to ensure scaffold diversity. Plan subsequent experimental validation (e.g., biochemical assays) for these high-confidence predictions.
Table 2: Key Software, Databases, and Hardware for Docking Research
| Category | Item Name | Function & Purpose | Access/Example |
|---|---|---|---|
| Traditional Docking Software | AutoDock Vina | Fast, open-source docking with good accuracy; standard for benchmarking. | Free Academic [1] [111] |
| Schrödinger Glide | High-accuracy commercial suite with robust search and scoring; industry standard. | Commercial License [16] [111] | |
| GOLD | Uses genetic algorithm; excellent for modeling ligand flexibility and metal interactions. | Commercial License [1] [111] | |
| AI/ML Docking Models | DiffDock | Diffusion model for blind docking; fast GPU-based inference. | Open Source (GitHub) [12] |
| SurfDock | Generative diffusion model achieving high pose accuracy. | Open Source [16] | |
| EquiBind / TankBind | Graph Neural Network models for fast pose prediction. | Open Source [12] | |
| Hybrid & Advanced Platforms | RosettaVS / OpenVS | AI-accelerated platform for ultra-large virtual screening with receptor flexibility. | Open Source [104] |
| Structure Preparation & Analysis | UCSF Chimera / PyMOL | Visualization, structure cleaning, and analysis of docking results. | Free/Commercial |
| RDKit | Cheminformatics toolkit for ligand preparation, manipulation, and descriptor calculation. | Open Source | |
| Validation & Benchmarking | PoseBusters | Critical toolkit for validating the physical and chemical correctness of any docking pose. | Open Source [16] |
| CASF2016 / DUD-E | Standard benchmark datasets for evaluating scoring power and virtual screening enrichment. | Publicly Available [104] | |
| Computational Resources | GPU (NVIDIA) | Essential for training and rapid inference of deep learning docking models (e.g., RTX 4090, A100). | Hardware |
| HPC Cluster | Required for large-scale virtual screening campaigns over billions of compounds. | Institutional Infrastructure |
The process of computer-aided drug discovery (CADD) relies heavily on computational tools like molecular docking to predict how small molecule drug candidates interact with protein targets at an atomic level. While docking provides valuable structural and energetic insights into potential binding modes, these predictions are ultimately computational hypotheses that require rigorous experimental validation in a physiologically relevant context [112]. Confirming direct binding to the intended target protein in living systems, known as target engagement, is a critical step in the pharmacological validation of new chemical probes and drug candidates [113]. This article details the application of the Cellular Thermal Shift Assay (CETSA) as a powerful, label-free experimental technique to bridge the gap between in silico predictions and in cellulo verification. CETSA fulfills a vital role in the broader thesis of CADD research by providing a direct, empirical readout of ligand-target interaction within the native cellular environment, thereby validating and refining the models generated by molecular docking simulations [112].
Principles and Mechanisms of CETSA
CETSA is a biophysical method that exploits the principle of ligand-induced thermal stabilization. The core concept is that a small molecule binding to its target protein reduces the protein's conformational flexibility, thereby enhancing its thermal stability [114]. In practice, this means the ligand-bound protein is more resistant to heat-induced denaturation and subsequent irreversible aggregation compared to its unbound state.
A typical CETSA experiment involves several key steps [113]:
- Drug Treatment: The cellular system (lysates, intact cells, or tissues) is treated with the compound of interest.
- Controlled Heating: Samples are subjected to a range of elevated temperatures, causing unbound proteins to denature.
- Lysis and Precipitation: Cells are lysed, and denatured, aggregated proteins are separated from the soluble fraction.
- Detection: The amount of remaining soluble, native protein is quantified.
The readout is a thermal aggregation curve (Tagg), where a rightward shift in the presence of a compound indicates successful target engagement. This stabilization is a direct result of compound binding and provides functional validation of computational docking poses within the complex cellular milieu [113] [112].
Key Experimental Formats and Data Analysis
CETSA experiments are conducted in two primary formats, each yielding distinct but complementary quantitative data for analysis [113].
Thermal Aggregation Curve (Tagg)
This format involves heating compound-treated and control samples across a gradient of temperatures (e.g., 37°C to 65°C). The percentage of soluble protein remaining at each temperature is plotted to generate a melting curve. The midpoint of this curve, the Tagg, is the temperature at which 50% of the protein is aggregated. A positive shift in Tagg (∆Tagg) for the drug-treated sample confirms stabilization and thus target engagement. This format is ideal for initial validation of binding for a single compound concentration.
Isothermal Dose-Response Fingerprint (ITDRFCETSA)
In this format, samples are treated with a gradient of compound concentrations and heated at a single, fixed temperature (typically near the Tagg of the unbound protein) [113] [114]. The resulting dose-response curve yields an EC₅₀ value, which represents the compound concentration required to stabilize 50% of the target protein. This format is superior for Structure-Activity Relationship (SAR) studies and ranking compound affinities, providing a quantitative metric that can be correlated with docking scores [113].
Table 1: Quantitative Data Outputs from Primary CETSA Formats
| Experimental Format | Key Variable | Primary Readout | Quantitative Metric | Primary Application |
|---|---|---|---|---|
| Thermal Aggregation Curve | Temperature Gradient | Protein Solubility vs. Temperature | ∆Tagg (Shift in °C) | Initial binding validation |
| Isothermal Dose-Response (ITDRF) | Compound Concentration | Protein Solubility vs. [Compound] | EC₅₀ (Concentration in M) | Affinity ranking & SAR |
Advanced and Integrated Formats
Beyond these core formats, CETSA has evolved into more powerful, proteome-wide applications:
- Mass Spectrometry-CETSA (MS-CETSA) / Thermal Proteome Profiling (TPP): This advanced variant uses mass spectrometry to detect thermal stability changes for thousands of proteins simultaneously [114]. It allows for unbiased target deconvolution for compounds with unknown mechanisms and comprehensive off-target profiling.
- Two-Dimensional TPP (2D-TPP): This method combines both a temperature gradient and a compound concentration gradient, analyzing the thermal stability of proteins across two dimensions. It provides a high-resolution view of binding dynamics and is a powerful tool for detailed mechanistic studies [114].
- Integration with Molecular Docking: As demonstrated in a JoVE protocol, CETSA serves as the critical experimental follow-up to computational docking. Researchers first use docking to predict the interaction between a compound (e.g., xanthatin) and a target (e.g., Keap1), then use CETSA to experimentally confirm the binding by observing a ∆Tagg [112].
Table 2: Comparison of CETSA with Other Label-Free Target Engagement Methods
| Method | Core Principle | Typical Throughput | Key Advantage | Key Limitation |
|---|---|---|---|---|
| CETSA | Ligand-induced thermal stabilization [114] | Medium to High [114] | Works in intact cells; detects membrane proteins [114] | Can be limited to soluble proteins in HTS formats [114] |
| DARTS | Ligand-induced protease resistance [114] | Low to Medium [114] | Simple; no specialized equipment needed [114] | Sensitivity depends on protease choice [114] |
| SPROX | Ligand-induced resistance to oxidation [114] | Medium to High [114] | Can provide binding site information [114] | Limited to methionine-containing peptides [114] |
Computer-Aided Drug Discovery Workflow
Detailed Experimental Protocols
General CETSA Protocol for Adherent Cells
This protocol outlines the key steps for a standard Western blot-based CETSA in adherent cell lines, adaptable for Tagg or ITDRF formats [113].
Materials: Cell line expressing target, compound of interest, DMSO, PBS, lysis buffer (e.g., with protease inhibitors), BCA assay kit, SDS-PAGE and Western blot equipment, heat block or thermal cycler for plates. Procedure:
- Cell Seeding & Treatment: Seed cells in appropriate dishes. Prior to assay, treat cells with compound or vehicle control (DMSO) for a predetermined time (e.g., 1-2 hours).
- Harvesting: Wash cells with PBS, gently scrape them into PBS, and transfer to microcentrifuge tubes. Pellet cells (e.g., 300 x g, 5 min).
- Heating: Resuspend cell pellets in a small volume of PBS supplemented with protease inhibitors. Aliquot equal volumes into PCR tubes. Heat aliquots at defined temperatures (e.g., from 37°C to 65°C in increments) for 3 minutes in a thermal cycler, followed by cooling at room temperature for 3 minutes.
- Lysis and Clarification: Add a volume of lysis buffer to each tube. Perform multiple freeze-thaw cycles (e.g., freeze in liquid nitrogen, thaw at 37°C) to ensure complete lysis [114]. Centrifuge at high speed (e.g., 20,000 x g, 20 min, 4°C) to pellet aggregated proteins.
- Analysis: Transfer the soluble supernatant to new tubes. Quantify total protein concentration using a BCA assay. Analyze the target protein levels by Western blot. Normalize band intensities to a loading control and plot the percentage of remaining soluble protein vs. temperature or compound concentration.
Protocol for CETSA in Primary Cells (Platelets)
This adapted protocol highlights CETSA's applicability in sensitive primary cells like human platelets [115]. Materials: Isolated human platelets, antiplatelet compounds, Tyrode’s buffer, prostaglandin E1, lysis buffer. Key Adaptations:
- Gentle Handling: Platelets are isolated from fresh blood in the presence of a weak anticoagulant and prostacyclin analog to maintain resting state.
- Compound Incubation: Washed platelets are incubated with the drug or vehicle in Tyrode’s buffer under gentle agitation.
- Micro-Scale Heating: Due to limited cell numbers, heating is performed in small volumes in a thermal cycler.
- Lysis & Detection: Post-heat challenge, platelets are lysed with detergent-based buffer. Soluble fractions are analyzed by Western blot for platelet-specific targets (e.g., kinases, integrins).
Protocol for Integrating Molecular Docking with CETSA Validation
This protocol from JoVE describes a direct pipeline from computational prediction to experimental validation [112]. Part A: Molecular Docking
- Structure Acquisition: Download the 3D structure of the target protein (e.g., Keap1, PDB: 2FLU) from the RCSB PDB and the ligand structure (e.g., xanthatin) from PubChem.
- Structure Preparation: Using software like Schrödinger Maestro, prepare the protein (remove water, add hydrogens, optimize H-bond network) and the ligand (generate tautomers/protonation states).
- Binding Site Definition & Grid Generation: Define the binding pocket (often the canonical site or via a sitemap calculation) and generate a grid for docking calculations.
- Docking Execution: Perform docking (e.g., using Glide XP mode) to generate predicted binding poses and docking scores.
- Pose Analysis: Analyze the top poses for key interactions (hydrogen bonds, hydrophobic contacts).
Part B: CETSA Experimental Validation
- Cell Culture & Treatment: Culture cells expressing the target (e.g., HEK293). Treat with the docked compound (xanthatin) or vehicle.
- CETSA Execution: Follow the general CETSA protocol (heating, lysis, fractionation) as outlined in 4.1.
- Correlation of Results: A positive thermal shift (∆Tagg) observed at a compound concentration consistent with the predicted binding affinity validates the docking-predicted interaction. The absence of a shift suggests the in silico model may require refinement or the compound may not engage the target in cells.
The Scientist's Toolkit: Key Research Reagent Solutions
Table 3: Essential Reagents and Materials for CETSA
| Reagent/Material | Function/Description | Key Considerations |
|---|---|---|
| Cellular Model System | Source of the endogenous target protein. Can be cell lysates, immortalized cell lines, or primary cells [113] [115]. | Choice dictates physiological relevance. Lysates simplify permeability issues; intact cells capture full cellular context. |
| Target-Specific Antibody | For detection of the protein of interest in Western blot or ELISA-based CETSA [113]. | The primary limitation for WB-CETSA. Must be specific, high-affinity, and recognize the denatured protein (for WB). |
| Homogeneous Detection Reagents (e.g., AlphaScreen, TR-FRET) | Enable antibody-based detection in a mix-and-read, plate-based format without wash steps, facilitating high-throughput[CITATION:1]. | Required for high-throughput CETSA (HT-CETSA). Requires two antibodies against different epitopes on the target. |
| MS-Compatible Lysis Buffer | For MS-CETSA/TPP, must efficiently solubilize proteins while being compatible with downstream trypsin digestion and mass spectrometry [114]. | Typically contains detergent like NP-40 and protease inhibitors. |
| Precision Thermal Cycler | Provides accurate and reproducible heating of multiple samples in PCR tubes or microplates [113]. | Essential for generating reliable Tagg curves. Plate-based systems enable higher throughput. |
| Compound Library | The set of small molecules to be screened for target engagement. | Includes positive control compounds (known binders) and vehicle controls (DMSO). |
CETSA Principle of Thermal Stabilization
CETSA in the Broader Drug Discovery Thesis
CETSA's value extends far beyond simple target validation. Within a CADD-driven thesis, it provides critical empirical data that closes the loop between prediction and biological reality.
- Validation of Docking Poses: CETSA confirms whether a compound predicted to bind in silico actually engages the target in a cellular environment, where factors like solubility, membrane permeability, and competing interactions come into play [112].
- Selectivity and Off-Target Profiling: Especially in its MS-CETSA/TPP format, CETSA enables unbiased selectivity profiling across thousands of proteins [116]. This helps identify off-target liabilities early, explaining unexpected phenotypes and improving compound safety profiles—a direct test of a docking model's specificity.
- Mechanism of Action Studies: By confirming engagement, CETSA links a compound's cellular phenotype directly to its molecular target. Furthermore, 2D-TPP can provide insights into binding mechanisms and allosteric effects [114].
- Guiding Medicinal Chemistry: ITDRFCETSA-derived EC₅₀ values provide a quantitative cellular affinity metric. This data is crucial for building robust SAR and guiding the iterative cycle of compound design, synthesis, and testing that is central to lead optimization [113].
CETSA's Role in the Drug Discovery Pipeline
Molecular Dynamics Simulations for Pose Refinement and Stability Assessment
Within the paradigm of computer-aided drug discovery (CADD), molecular docking serves as a pivotal, high-throughput methodology for predicting how small molecule ligands interact with biological targets. However, conventional docking approaches are often constrained by simplified scoring functions and limited treatment of molecular flexibility, which can compromise the accuracy of predicted binding poses and their associated affinity rankings [117]. These limitations underscore a critical need for post-docking validation and optimization.
Molecular Dynamics (MD) simulations have emerged as an indispensable tool for addressing these shortcomings. By simulating the physical movements of atoms and molecules over time, MD provides an atomic-resolution, dynamic perspective that is absent from static docking snapshots. In the context of a broader thesis on advancing molecular docking methods, this article details how MD simulations are specifically applied for two interconnected objectives: the refinement of docked poses to achieve structurally realistic complexes, and the assessment of binding stability to differentiate viable drug candidates. These applications transform preliminary docking hits into computationally robust models, thereby de-risking subsequent experimental validation and accelerating the drug discovery pipeline.
Application Notes: Core Functions and Quantitative Benchmarks
MD-based refinement and stability assessment bridge the gap between high-throughput docking and high-accuracy modeling. This section outlines the key applications and presents quantitative data on the performance of current methodologies.
Pose Refinement and Scoring
Pose refinement corrects steric clashes, optimizes side-chain conformations, and induces subtle backbone adjustments at the binding interface, yielding models that are more physically plausible. This process is crucial because rigid-body docking often produces poses with minor atomic overlaps or suboptimal interaction geometries [118]. Refinement methods can be categorized by their approach to structural flexibility:
- Backbone-Mobile Methods: These protocols, such as those implemented in Galaxy-Refine-Complex or HADDOCK, allow for movement in the protein backbone. They are powerful for correcting larger structural deviations but carry a risk of distorting the overall fold if not properly restrained [118].
- Backbone-Fixed Methods: Tools like Rosetta FastRelax and SCWRL primarily repack side-chain rotamers while keeping the backbone fixed. These are more conservative and are highly effective at optimizing interfacial contacts without compromising the global structure [118].
The SILCS-MC platform exemplifies a dedicated pose refinement protocol. It uses Monte Carlo sampling within a field defined by FragMaps (which encode favorable interaction sites) to locally optimize ligand conformation and orientation. This method is specifically recommended for refining poses within a congeneric series after an initial docking screen [119].
Recent advancements focus on integrating experimental data directly into the refinement process to improve accuracy. The MDRefine package, for instance, refines MD-generated ensembles by biasing them to agree with experimental observables, thereby improving the agreement between simulation and reality [120].
Table 1: Comparison of Selected MD-Based Refinement Tools and Applications
| Tool/Method Name | Primary Refinement Target | Key Technique | Typical Use Case | Reference |
|---|---|---|---|---|
| SILCS-MC (Pose Refinement) | Ligand pose and conformation | Monte Carlo sampling in FragMap fields | Local optimization of a known ligand pose or congeneric series [119]. | [119] |
| MDRefine | MD ensemble, force field, or forward model | Bayesian ensemble refinement with experimental data | Improving simulation accuracy using NMR, SAXS, or other biophysical data [120]. | [120] |
| Galaxy-Refine-Complex | Protein complex interface | Iterative side-chain perturbation & restrained MD | Refining protein-protein or protein-ligand docked poses [118]. | [118] |
| Thermal Titration MD (TTMD) | Binding mode stability | Series of MD simulations at increasing temperatures | Discriminating native-like binding poses from decoys for RNA-ligand complexes [117]. | [117] |
| CHARMM Relaxation Protocol | Atomic coordinates & energy | Short MD simulation with harmonic restraints | General-purpose relaxation of docked structures to relieve steric strain [118]. | [118] |
Stability Assessment and Mutation Analysis
Beyond refining a single static pose, MD simulations are critical for assessing the thermodynamic and kinetic stability of a binding mode. A stable binding pose demonstrates persistent key interactions (e.g., hydrogen bonds, hydrophobic contacts) throughout the simulation trajectory, whereas an unstable pose may undergo significant deviation or dissociation.
Stability metrics include:
- Root Mean Square Deviation (RMSD) of the ligand relative to the binding site.
- Interaction Fingerprint Persistence: Monitoring the lifetime of specific atomic contacts.
- Free Energy Estimation: Using advanced sampling methods to calculate binding affinities.
This assessment directly informs lead optimization. For example, the BoostMut tool automates the analysis of MD simulations to identify stabilizing mutations. By analyzing dynamic structural features like residue flexibility, solvation, and energy contributions, it filters mutation candidates predicted by sequence-based tools, significantly improving the success rate of engineering thermostable proteins [121].
Table 2: Quantitative Performance Benchmarks of Refinement Methods [118]
| Refinement Method | Type | Avg. fnat Improvement* (ZDOCK Benchmark) | Success Rate for Retaining/Improving iRMSD* | Key Performance Insight |
|---|---|---|---|---|
| HADDOCK (flex) | Backbone-Mobile | +0.06 | 62% | Effective at improving interface contacts, but can worsen backbone placement. |
| Galaxy-Refine-Complex | Backbone-Mobile | +0.04 | 58% | Balanced protocol with moderate, consistent improvements. |
| CHARMM Relaxation | Backbone-Mobile | +0.03 | 65% | High rate of retaining good models; conservative and reliable. |
| Rosetta FastRelax | Backbone-Fixed | +0.05 | 71% | Excellent at side-chain repacking; best overall at not degrading model quality. |
| SCWRL4 | Backbone-Fixed | +0.04 | 69% | Fast, side-chain-only refinement with high fidelity. |
- fnat: Fraction of native contacts recovered. iRMSD: Interface RMSD (lower is better). Data derived from benchmarking on ideally positioned docking models [118].
Detailed Experimental Protocols
Protocol 1: SILCS-MC for Pose Refinement
This protocol refines a pre-docked ligand pose using the SILCS (Site Identification by Ligand Competitive Saturation) methodology [119]. 1. System Setup:
- Input Requirements: Provide a protein structure (PDB format) and the ligand pose to be refined (SDF or MOL2 format). The ligand must include all hydrogens with pH-appropriate protonation states [119].
- FragMaps: Obtain pre-computed SILCS FragMaps for the target protein. These maps encode the favorable binding sites for different chemical functional groups. 2. Pocket Definition:
- The refinement region is automatically defined as a sphere centered on the ligand's center-of-geometry. The default radius is sufficient for most applications [119]. 3. Monte Carlo Sampling:
- Execute the
1_run_silcsmc_localcommand-line script [119]. - The algorithm performs local Monte Carlo sampling, exploring ligand translations (max step ~0.2 Å), rotations (max step ~9°), and torsional rotations (max step ~9°) within the defined sphere [119].
- Sampling continues until the Ligand Grid Free Energy (LGFE) score converges or for a defined number of cycles. 4. Pose Selection:
- The output is a set of refined poses. The final pose is selected based on the best (lowest) LGFE score, which represents the most favorable interaction with the protein's FragMaps [119].
Protocol 2: Post-Docking Filtering with Thermal Titration MD (TTMD)
TTMD is an enhanced sampling method used to discriminate correct binding poses from incorrect decoys by evaluating their thermal stability [117]. 1. Initial Pose Generation:
- Generate multiple docking poses for the ligand-target complex using any standard docking software (e.g., AutoDock Vina, HADDOCK). 2. System Preparation:
- Solvate each complex in an explicit water box (e.g., TIP3P water model). Add ions to neutralize the system and achieve physiological salt concentration.
- Energy minimize the system to relieve steric clashes. 3. Thermal Titration Simulation:
- Perform a series of short, independent MD simulations (e.g., 5-10 ns each) at progressively higher temperatures (e.g., 300 K, 325 K, 350 K, 400 K).
- Use a mild restraint (e.g., 1 kcal/mol/Ų) on the protein backbone to prevent global denaturation while allowing ligand mobility. 4. Stability Analysis:
- For each temperature window, calculate the ligand's RMSD relative to its starting position and monitor the persistence of key binding interactions.
- A native-like pose will typically maintain a low RMSD and preserve interactions at moderate elevated temperatures (e.g., 350 K), while decoy poses will rapidly deviate [117]. 5. Pose Ranking:
- Rank all initial docking poses based on their stability profile across the temperature gradient. The most stable pose is selected for further analysis.
Protocol 3: Stability Analysis for Mutation Design Using BoostMut
This protocol uses MD simulations to analyze and predict stabilizing mutations [121]. 1. Wild-Type Simulation:
- Run an MD simulation (e.g., 100-500 ns) of the wild-type protein to establish a baseline for flexibility and stability. 2. Mutation Selection & Modeling:
- Generate a list of candidate mutations using a sequence-based predictor or evolutionary data.
- Create 3D models for each mutant using side-chain packing software (e.g., SCWRL, FoldX). 3. Mutant Simulation Ensemble:
- Run a shorter MD simulation (e.g., 50-100 ns) for each mutant structure. Multiple replicates are recommended. 4. Automated Analysis with BoostMut:
- Process all simulation trajectories (wild-type and mutants) with BoostMut [121].
- The tool automatically extracts features such as:
- Per-residue root-mean-square fluctuation (RMSF).
- Solvent-accessible surface area (SASA).
- Hydrogen bond and salt bridge networks.
- Internal energy contributions. 5. Stability Prediction:
- BoostMut integrates these dynamic features, and optionally a light machine learning model, to score and rank mutations by predicted stabilizing effect [121]. 6. Experimental Validation:
- Select top-ranked mutations for experimental testing (e.g., thermal shift assay, activity measurement).
The Scientist's Toolkit: Essential Research Reagents & Software
Table 3: Key Software Tools for MD-Based Refinement and Analysis
| Category | Tool Name | Primary Function | License Model | Reference |
|---|---|---|---|---|
| MD Simulation Engines | GROMACS | High-performance MD simulation, widely used for biomolecules. | Open Source (GPL) | [122] [123] |
| AMBER | Suite for MD simulation and energy minimization, popular in drug discovery. | Proprietary & Open Source | [122] [123] | |
| NAMD | Parallel MD simulator designed for large biomolecular systems. | Free for Academic Use | [124] [123] | |
| OpenMM | Toolkit for MD simulation with strong GPU acceleration and Python API. | Open Source (MIT) | [122] | |
| Specialized Refinement & Analysis | MDRefine | Python package to refine MD ensembles using experimental data. | Open Source | [120] |
| BoostMut | Automated tool for analyzing MD simulations to identify stabilizing mutations. | Not Specified (Academic) | [121] | |
| SILCS-MC | Software for Monte Carlo-based ligand docking and pose refinement. | Commercial | [119] | |
| Visualization & Analysis | VMD | Visualize, analyze, and animate MD trajectories. | Free for Academic Use | [124] |
| PyMOL / ChimeraX | Molecular graphics for visualizing structures and rendering publication-quality images. | Commercial / Open Source | [122] |
Workflow Visualization
MD Workflow for Pose Refinement
Stability Assessment for Mutation Design
Assessing Holo-structure Recovery and Cryptic Pocket Identification
Within the paradigm of computer-aided drug discovery (CADD), the accurate prediction of protein-ligand interactions is foundational [2]. A central thesis in modern molecular docking research posits that effective drug design is contingent upon two interdependent challenges: the recovery of biologically relevant, ligand-bound (holo) conformations from unbound (apo) starting points, and the identification of transient, ligandable sites known as cryptic pockets [125] [126]. Traditional docking protocols often treat the protein target as rigid, a significant limitation given that binding-induced conformational changes are the rule rather than the exception [2]. This rigidity fails to account for the dynamic nature of many therapeutic targets, particularly protein-protein interactions (PPIs) and historically "undruggable" proteins that lack stable binding clefts [127]. Consequently, the integration of advanced sampling techniques and artificial intelligence (AI) has become critical to model protein flexibility, predict holo-structure recovery, and expose cryptic pockets that emerge from protein dynamics [125] [128] [129]. This document provides detailed application notes and protocols for assessing these twin pillars of contemporary structure-based drug design, offering researchers a framework to validate and apply these advanced computational methodologies.
Holo-structure Recovery: Protocols and Assessment
Holo-structure recovery refers to the computational prediction of a protein's three-dimensional conformation when bound to a ligand, starting from its apo state or a generic model. Success in this area directly impacts the accuracy of virtual screening and binding pose prediction [127].
Integrated Workflow for Holo-structure Recovery and Cryptic Pocket Detection
The following diagram illustrates a synergistic computational pipeline that leverages both traditional and AI-driven methods to address protein flexibility, from initial structure preparation to final complex prediction and validation.
Key Methodologies and Protocols
Protocol 1: Generating Conformational Ensembles with Molecular Dynamics (MD)
- Objective: To sample the flexible landscape of a target protein and generate multiple conformations for ensemble docking.
- Procedure:
- System Preparation: Obtain an apo structure (experimental PDB or AlphaFold2 model) [127] [129]. Solvate the protein in a water box (e.g., TIP3P water model). Add ions to neutralize the system's charge.
- Energy Minimization: Perform steepest descent and conjugate gradient minimization to remove steric clashes.
- Equilibration: Run simulations in canonical (NVT) and isothermal-isobaric (NPT) ensembles to equilibrate the solvent and system density at the target temperature (e.g., 300 K) and pressure (1 bar).
- Production MD: Conduct an unbiased or enhanced sampling production run. For cryptic pocket discovery, consider adaptive sampling algorithms like FAST (Fluctuation Amplification of Specific Traits), which prioritize simulations from states with large pocket volumes [128].
- Trajectory Analysis: Cluster frames from the trajectory based on protein backbone RMSD. Select representative conformations (centroids of the largest clusters) for the docking ensemble.
Protocol 2: Docking into Flexible Receptors using Umol & AlphaFold2
- Objective: To predict the bound structure of a protein-ligand complex directly from sequence or using refined models, accounting for full flexibility.
- Procedure:
- Input Preparation: For the AI-based tool Umol, provide the target protein's amino acid sequence and the ligand's SMILES string [129]. Optionally, define a target pocket if known.
- Co-folding Prediction: Execute Umol to generate a 3D structure of the complex. The model outputs a predicted local Distance Difference Test (plDDT) per residue and for the ligand, which indicates prediction confidence [129].
- Alternative AF2-Based Pipeline: If using a structure-based docking suite:
- Pose Selection and Validation: Rank poses by docking score or by the AI model's confidence metric (ligand plDDT). High ligand plDDT correlates with lower ligand RMSD and higher binding affinity [129]. Validate top poses by checking for key known interactions (e.g., hydrogen bonds, hydrophobic contacts).
Protocol 3: Benchmarking Docking Performance for PPIs
- Objective: To evaluate the ability of different docking protocols to recover known holo-structures of protein-protein/peptide interactions (PPIs), a particularly challenging class of targets [127].
- Procedure:
- Dataset Curation: Compile a set of experimentally solved structures for PPIs with known modulator ligands (e.g., from 2P2Idb or ChEMBL) [127].
- Structure Preparation: Generate multiple receptor models: (a) the native holo structure from PDB, (b) the native apo structure (if available), (c) an AF2 model from the sequence, and (d) an MD-refined ensemble from (c).
- Docking Execution: Perform local docking (restricting the search space to the known interface) and blind docking across the entire protein surface using multiple algorithms (e.g., Glide, AutoDock Vina, TankBind) [127].
- Performance Metrics: Calculate the success rate (SR), defined as the fraction of predictions where the ligand RMSD (L-RMSD) is ≤ 2.0 Å from the native pose. Record docking scores and compute enrichment factors (EF) in virtual screening trials [127] [129].
Quantitative Performance Benchmark of Docking Methods
Table 1: Performance comparison of structure prediction and docking methods in recovering holo-like complexes. [127] [129]
| Method Category | Specific Method | Required Input | Key Performance Metric (Success Rate/Accuracy) | Primary Use Case | Reference |
|---|---|---|---|---|---|
| Classical Docking | AutoDock Vina | Native holo structure, pocket definition | 52% SR (L-RMSD ≤ 2Å) | Docking into known, rigid pockets | [129] |
| AI Co-folding | Umol (with pocket info) | Protein sequence, ligand SMILES, pocket residues | 45% SR (L-RMSD ≤ 2Å) | Flexible complex prediction when pocket is known | [129] |
| AI Co-folding | RoseTTAFold All-Atom | Protein sequence, ligand SMILES | 42% SR (L-RMSD ≤ 2Å) | Blind flexible complex prediction | [129] |
| AF2+Docking | AlphaFold2 + DiffDock | Protein sequence, ligand SMILES | 21% SR (L-RMSD ≤ 2Å) | Docking when no experimental structure exists | [129] |
| Ensemble Docking | MD-refined AF2 models + Glide | AF2 model, MD ensemble | Variable improvement; performance depends on scoring function | Docking into flexible PPIs | [127] |
| Confidence Metric | Umol Ligand plDDT | Model output | 72% SR for poses with plDDT > 80 | Distinguishing high vs. low accuracy predictions | [129] |
Cryptic Pocket Identification: Protocols and Assessment
Cryptic pockets are potential binding sites that are not visible in a protein's ground-state structure but form transiently due to conformational dynamics. Their identification is crucial for targeting proteins considered "undruggable" [125] [126].
Cryptic Pocket Detection and Characterization Workflow
This diagram outlines the decision process and primary computational strategies for identifying and characterizing cryptic binding pockets on protein targets.
Key Methodologies and Protocols
Protocol 4: Rapid Prediction with PocketMiner (Graph Neural Network)
- Objective: To quickly screen single protein structures for their likelihood of containing cryptic pockets and predict their approximate location.
- Procedure:
- Input Preparation: Provide a single coordinate file (PDB format) of the apo protein structure.
- Model Execution: Run the pre-trained PocketMiner graph neural network [128]. The model was trained to predict where pockets open in MD simulations based on residue-level features of the static input structure.
- Output Analysis: The model outputs a per-residue propensity score (0 to 1) indicating the likelihood that the residue will be part of a cryptic pocket. Visualize these scores on the protein surface to identify "hotspot" regions.
- Validation: For high-scoring regions, initiate short, targeted MD simulations (see Protocol 5) to physically observe pocket opening. PocketMiner achieves an ROC-AUC of 0.87 on experimental cryptic pockets and is over 1000-fold faster than simulation-based methods [128].
Protocol 5: Detection via Mixed-Solvent Molecular Dynamics (MixMD)
- Objective: To use small organic probe molecules in simulation to spontaneously induce and map the surface of cryptic pockets.
- Procedure:
- System Setup: Solvate the apo protein in an aqueous solution containing a low concentration (e.g., 2-5% v/v) of small organic solvents like acetonitrile, isopropanol, or pyridine, which mimic various chemical functionalities of drugs [125] [126].
- Simulation Run: Perform an extended MD simulation (hundreds of nanoseconds to microseconds). The probe molecules will preferentially congregate in regions of the protein surface with favorable chemical compatibility, including nascent cryptic sites.
- Density Analysis: Calculate the 3D density maps for each probe type throughout the simulation. Regions with high, persistent probe density indicate potential ligandable hotspots, including cryptic pockets.
- Pocket Definition: Cluster the high-density regions and use a pocket detection algorithm (e.g., FPocket, LIGSITE) to define the boundaries of the induced pocket.
Protocol 6: Enhanced Sampling with the FAST Algorithm
- Objective: To efficiently sample rare conformational events, such as cryptic pocket opening, that occur on timescales beyond standard MD.
- Procedure:
- Initial Sampling: Launch multiple short (e.g., 40 ns) MD simulations from the apo state [128].
- Markov State Model (MSM) Construction: Cluster all sampled structures and estimate transition probabilities between states to build an MSM.
- Goal-Oriented Reseeding: Use the FAST algorithm to analyze the MSM. It prioritizes and launches new simulations from conformational states that exhibit traits associated with pocket opening (e.g., larger volume, specific side-chain rotations) [128].
- Iteration: Repeat steps 2-3 for several rounds. This adaptive sampling focuses computational resources on the most relevant regions of conformational space, significantly accelerating the observation of pocket opening events.
Comparative Analysis of Cryptic Pocket Detection Methods
Table 2: Characteristics and applications of major computational methods for cryptic pocket identification. [125] [126] [128]
| Method | Underlying Principle | Typical Timescale | Key Strength | Key Limitation | Best For |
|---|---|---|---|---|---|
| PocketMiner (GNN) | Supervised ML on simulation data; predicts opening propensity from single structure. | Seconds to minutes per protein. | Extreme speed (>>1000x faster than MD); high accuracy (AUC 0.87); proteome-scale screening. | Provides propensity, not atomic details of dynamics; requires validation. | Initial triage and prioritization of targets likely to harbor cryptic pockets. |
| Mixed-Solvent MD (MixMD) | MD simulation with small organic probe molecules in solution. | 100 ns – 1 μs. | Experimentally mimics fragment screening; provides chemical mapping of pocket surfaces. | Computationally expensive; probe concentration and choice can bias results. | Characterizing the chemical "flavor" and location of cryptic sites. |
| Enhanced Sampling (FAST) | Adaptive sampling guided by Markov State Models to accelerate rare events. | Effective sampling of μs-ms events. | Efficiently captures rare conformational transitions; generates mechanistic insight. | Setup and analysis complexity; requires significant computational resources. | Studying the detailed atomic pathway and mechanism of pocket opening. |
| Conventional MD | Unbiased simulation of protein in explicit solvent. | 10 ns – 10 μs. | No bias; captures true thermodynamic fluctuations. | Often insufficient to observe rare pocket openings; computationally prohibitive for large systems. | Studying highly dynamic proteins or validating predictions from faster methods. |
The Scientist's Toolkit: Essential Research Reagents & Materials
Table 3: Key computational tools, software, and resources for conducting research on holo-structure recovery and cryptic pocket identification. [2] [40] [128]
| Category | Item / Software | Primary Function in Research | Typical Application / Note |
|---|---|---|---|
| Structure Prediction & Modeling | AlphaFold2 / RoseTTAFold | Predicts high-accuracy protein structures from amino acid sequence. | Generating starting models when experimental structures are unavailable [127] [129]. |
| I-TASSER | Protein structure and function prediction via iterative threading. | Alternative to AF2 for homology modeling and function annotation [40]. | |
| Molecular Dynamics & Sampling | GROMACS / AMBER / NAMD | Software suites for running molecular dynamics simulations. | Exploring protein flexibility, generating ensembles, and running MixMD or FAST protocols [125] [128]. |
| FAST Algorithm | Goal-oriented adaptive sampling plugin for MD. | Efficiently sampling rare events like cryptic pocket opening [128]. | |
| Cryptic Pocket Detection | PocketMiner | Graph neural network for predicting cryptic pocket locations from a single structure. | Fast, initial screening and prioritization of cryptic pocket candidates [128]. |
| CryptoSite | Machine learning predictor of ligand-binding cryptic pockets. | Older ML method; uses structural and simulation features [128]. | |
| Docking & Scoring | AutoDock Vina / Glide (Schrödinger) | Widely used molecular docking programs for pose prediction and scoring. | Standard tools for rigid and flexible ligand docking [2] [127] [129]. |
| Umol | AI system for predicting fully flexible protein-ligand complexes from sequence. | Co-folding approach when significant induced fit is expected [129]. | |
| Analysis & Visualization | PyMOL / ChimeraX | Molecular visualization and analysis software. | Visualizing structures, pockets, trajectories, and docking poses. |
| MDTraj / MDAnalysis | Python libraries for analyzing MD trajectories. | Calculating RMSD, pocket volumes, and other essential metrics from simulation data. | |
| Validation Databases | Protein Data Bank (PDB) | Repository for 3D structural data of proteins and nucleic acids. | Source of experimental apo/holo structures for benchmarking [2]. |
| 2P2Idb / ChEMBL | Databases of protein-protein interaction modulators and bioactive molecules. | Source of targets and active ligands for benchmarking PPI docking [127]. |
Integration with Multi-Omics Data for Enhanced Target Discovery
The identification and validation of novel, druggable targets is a critical bottleneck in pharmaceutical research [130]. Traditional computer-aided drug discovery (CADD) methods, such as molecular docking and pharmacophore modeling, have historically relied on single-dimensional biological data, which can overlook the complex, systemic nature of disease biology [131] [132]. The integration of multi-omics data—spanning genomics, transcriptomics, proteomics, and metabolomics—represents a paradigm shift, offering a holistic, multi-layered view of biological systems [133] [134]. This integration, framed within the broader thesis of advancing molecular docking and computational methods, moves target discovery from a single-target, single-data-type approach to a systems-level understanding of disease mechanisms.
The convergence of high-throughput omics technologies, sophisticated bioinformatics pipelines, and artificial intelligence (AI) is now enabling researchers to deconvolute disease heterogeneity, identify robust biomarkers, and pinpoint causal molecular drivers with greater precision [135] [136] [130]. For instance, while transcriptomics can suggest gene activity, proteomics confirms the presence and modification of proteins, and metabolomics reveals the functional biochemical output; their integration significantly increases confidence in target candidacy and reduces false positives [133] [134]. This article details the application notes and protocols for integrating multi-omics data into computational drug discovery workflows, providing researchers with actionable methodologies to enhance and validate novel therapeutic targets.
Foundational Strategies for Multi-Omics Data Integration
Effective multi-omics integration requires strategic approaches to combine heterogeneous, high-dimensional datasets. The choice of integration strategy is dictated by the biological question, data types, and desired output. Two principal methodological frameworks are similarity-based and difference-based integration, often implemented through a suite of computational tools [133].
Similarity-based methods identify common patterns and correlations across omics layers. Techniques include correlation analysis, clustering algorithms (e.g., hierarchical clustering, k-means), and network-based approaches like Similarity Network Fusion (SNF). These methods are ideal for discovering overarching biological modules and pathways co-regulated across multiple molecular levels [133].
Difference-based methods focus on detecting unique, discriminatory features within each omics dataset that are associated with a phenotype (e.g., disease vs. healthy). Key techniques include differential expression/abundance analysis, variance decomposition, and feature selection methods like LASSO or Random Forests. These are crucial for identifying specific molecular signatures and biomarkers [133].
For unified analysis, several advanced algorithms have become standard:
- Multi-Omics Factor Analysis (MOFA): An unsupervised method that uses Bayesian factor analysis to identify a set of latent factors that capture the common and unique sources of variation across multiple omics datasets [133].
- Canonical Correlation Analysis (CCA): Identifies linear relationships between two sets of multi-omics variables, facilitating the discovery of correlated patterns [133].
Table 1: Core Multi-Omics Data Integration Strategies and Tools
| Integration Strategy | Description | Example Algorithms/Tools | Primary Application in Target Discovery |
|---|---|---|---|
| Similarity-Based | Identifies common patterns, correlations, and co-regulated networks across omics layers. | Similarity Network Fusion (SNF), Hierarchical Clustering, Correlation Analysis | Uncovering conserved regulatory modules and central hub proteins in disease pathways. |
| Difference-Based | Detects unique, discriminatory features within each omics dataset associated with a phenotype. | Differential Expression Analysis, LASSO, Random Forests | Identifying disease-specific biomarkers and aberrantly expressed potential drug targets. |
| Model-Based | Uses statistical models to decompose variation and infer latent factors explaining data structure. | Multi-Omics Factor Analysis (MOFA), Canonical Correlation Analysis (CCA) | Disentangling shared vs. unique molecular signals across omics to pinpoint core drivers. |
| Network-Based | Integrates data by constructing and analyzing biological networks (e.g., PPI, co-expression). | OmicsNet, NetworkAnalyst, Cytoscape | Visualizing and prioritizing targets within the context of interactive disease networks. |
These integrated analyses are powered by specialized platforms. OmicsNet and NetworkAnalyst are critical for visual network analysis, allowing researchers to build comprehensive interaction networks from genes, proteins, and metabolites [133]. For managing complex computational workflows, pipeline managers like Nextflow and Snakemake ensure reproducibility and scalability. Adhering to FAIR (Findable, Accessible, Interoperable, Reusable) principles—by using version control, software containers (Docker/Singularity), and rich metadata packaging (e.g., RO-Crate)—is essential for creating shareable, reusable analysis workflows [137].
Multi-Omics Data Integration and Analysis Workflow
AI-Driven Target Discovery from Integrated Multi-Omics Data
Artificial Intelligence, particularly machine learning (ML) and deep learning (DL), has become indispensable for extracting meaningful patterns from integrated multi-omics data, transforming vast datasets into testable biological hypotheses [131] [130] [132].
Bulk Multi-Omics Deep Learning: ML models can be trained on bulk omics data from tissue samples to identify disease-associated molecules and pathways. These models perform tasks such as cancer subtype classification, survival prediction, and driver gene identification. The key advantage is the ability to integrate thousands of features from different omics layers to predict clinical outcomes or molecular phenotypes, thereby highlighting potential therapeutic targets [130].
Single-Cell Multi-Omics AI: Single-cell technologies resolve cellular heterogeneity, a major challenge in diseases like cancer and neurodegeneration. AI approaches are crucial for analyzing this data, performing cell type annotation, inferring gene regulatory networks (GRNs), and modeling cell-cell communication. These analyses can reveal cell-type-specific drug targets that would be masked in bulk data, enabling the design of more precise therapies [135] [130]. For example, integrating single-cell transcriptomics with proteomic data can identify surface markers unique to pathogenic cell subsets.
Perturbation-Based Causal Inference: Moving from correlation to causation, AI-enhanced analysis of perturbation omics (e.g., CRISPR screens, drug treatment datasets) is powerful for target identification. Models can simulate the molecular consequences of gene knockdown or drug treatment, pinpointing key regulatory nodes and synthetic lethal interactions. This allows for the prediction of drug combinations and the identification of targets whose inhibition has a cascading therapeutic effect [130].
Structural Biology & AI Integration: AI has revolutionized structural biology. Tools like AlphaFold provide highly accurate protein structure predictions, creating opportunities for in silico docking screens against previously "undruggable" targets with no experimental structure [131] [130]. Furthermore, AI can predict protein-ligand binding affinities and optimize compound properties, creating a direct bridge from omics-identified targets to structure-based drug design [132].
Table 2: AI/ML Applications in Multi-Omics Target Discovery
| AI Approach | Data Input | Key Function | Output for Target Discovery |
|---|---|---|---|
| Deep Learning on Bulk Omics | Integrated genomics, transcriptomics, proteomics from tissue samples. | Disease subtype classification, survival prediction, driver gene detection. | Ranked list of genes/proteins associated with disease severity or progression. |
| Single-Cell Data Analysis | Single-cell RNA-seq, ATAC-seq, proteomics (CITE-seq). | Cell clustering, trajectory inference, GRN reconstruction. | Identification of targets specific to rare, pathogenic cell populations. |
| Causal ML / Perturbation Modeling | CRISPR screen data, drug perturbation transcriptomics/proteomics. | Inference of causal gene relationships, simulation of intervention effects. | Causal therapeutic targets and predicted synergistic drug combinations. |
| Structure Prediction & Docking | Protein sequence, chemical compound libraries. | Protein 3D structure prediction (AlphaFold), virtual screening, binding affinity prediction. | Prioritized small molecules for experimental testing against novel targets. |
Application Notes & Experimental Protocols
Protocol: A Subtractive Proteomics Pipeline for Novel Bacterial Target Identification
This protocol outlines a computational subtractive proteomics workflow to identify essential, non-host homologous, druggable targets in pathogenic bacteria, as demonstrated for Waddlia chondrophila [138]. It serves as a prime example of how sequential bioinformatic filters can narrow a proteome to a few high-priority targets.
1. Sequence Retrieval and Redundancy Removal:
- Objective: Obtain a non-redundant protein set.
- Method: Download the complete proteome of the pathogen of interest in FASTA format from UniProt. Use the CD-HIT suite with an 80% sequence identity cutoff to cluster and remove redundant paralogous sequences [138].
2. Identification of Non-Homologous Essential Proteins:
- Objective: Filter out proteins with significant similarity to the human host to minimize potential off-target effects.
- Method: Perform a BLASTp search of the non-redundant bacterial proteins against the human proteome. Set an E-value threshold (e.g., 10^-5). Proteins with a query cover >30% and identity >70% are typically considered homologous and are removed from the candidate list [138].
3. Subcellular Localization Prediction:
- Objective: Prioritize cytoplasmic and membrane proteins, which are more accessible for small-molecule drugs.
- Method: Submit the filtered protein list to subcellular localization predictors such as PSORTb and CELLO. Retain proteins predicted to be cytoplasmic or membrane-localized for further analysis [138].
4. Metabolic Pathway Analysis and Druggability Assessment:
- Objective: Identify targets in pathways essential to the pathogen but absent in the host.
- Method:
- Map the candidate proteins to metabolic pathways using the KEGG (Kyoto Encyclopedia of Genes and Genomes) database.
- Compare bacterial pathways with human pathways to select those unique or essential to the pathogen.
- Perform a druggability assessment by querying the DrugBank database via BLAST to check if the candidate proteins have known structural homologs that are successful drug targets [138].
5. Target Validation and Preparation for Docking:
- Objective: Generate and validate 3D structures for molecular docking.
- Method: For proteins without experimental structures, use AlphaFold2 to predict high-confidence 3D models. Validate the model quality using tools like PROCHECK (stereochemical quality), Verify3D (sequence-structure compatibility), and ProSA-web (energy validation) [138]. Prepare the structure for docking by adding hydrogens, assigning partial charges, and defining the active site.
Protocol: Virtual Screening of Phytochemical Libraries Against Novel Targets
Following target identification, this protocol details a virtual screening workflow to identify potential inhibitors from natural compound libraries [138].
1. Library Preparation:
- Objective: Create a curated, energetically minimized library of phytochemicals.
- Method: Collect phytochemical structures from databases like PubChem, ZINC, and MPD3. Use software like ChemDraw for structure drawing and Molecular Operating Environment (MOE) for energy minimization. Employ the MMFF94x force field and the Protonate3D tool to add partial charges at physiological pH (7.4) and temperature (310K) [138].
2. Molecular Docking and Pose Selection:
- Objective: Predict binding poses and affinities of ligands to the target.
- Method:
- In MOE, use the Site Finder module to identify the active site/binding pocket on the validated target protein.
- Dock the prepared ligand library using a docking algorithm (e.g., MOE Dock). Use the London dG scoring function for initial pose placement and ranking.
- Select the top-ranking compounds based on binding affinity (S-score) and visual inspection of binding poses for key interactions (hydrogen bonds, hydrophobic contacts) [138].
3. Binding Free Energy Validation and ADMET Prediction:
- Objective: Refine affinity predictions and filter for drug-like properties.
- Method:
- Perform more rigorous binding free energy calculations on top docked complexes using methods like Molecular Mechanics/Generalized Born Surface Area (MM/GBSA).
- Subject the top candidates to in silico ADMET (Absorption, Distribution, Metabolism, Excretion, Toxicity) profiling. Use tools like SwissADME or admetSAR to predict properties such as gastrointestinal absorption, blood-brain barrier penetration, cytochrome P450 inhibition, and Ames mutagenicity. Filter out compounds with poor predicted pharmacokinetics or toxicity [138] [131].
Computational Target Identification & Validation Pipeline
The Scientist's Toolkit: Essential Research Reagent Solutions
Table 3: Key Resources for Multi-Omics Target Discovery Workflows
| Category | Resource/Solution | Function in Workflow | Key Features / Notes |
|---|---|---|---|
| Omics Databases | UniProt, Ensembl, MetaboLights, GEO, PRIDE | Provide raw and annotated omics data (sequences, expressions, metabolites) for analysis and comparison. | Essential for data retrieval; adhere to community standards (e.g., ISA-Tab format for metadata) [137] [133]. |
| Compound Libraries | ZINC, PubChem, ChEMBL, MPD3 | Curated repositories of purchasable or known bioactive small molecules and phytochemicals for virtual screening. | Provide 2D/3D chemical structures, properties, and bioactivity data [138] [131]. |
| Target/Drug Databases | DrugBank, KEGG, Pharos | Annotate protein targets, pathways, and drug-target interactions for druggability assessment and repurposing. | Crucial for the subtractive proteomics and validation steps [138] [130]. |
| Bioinformatics Software | Nextflow/Snakemake, OmicsNet, NetworkAnalyst, Galaxy | Pipeline orchestration, data integration, network visualization, and user-friendly analysis interfaces. | Enable reproducible, scalable workflows and intuitive data exploration [137] [133] [139]. |
| AI/Modeling Platforms | AlphaFold, MOE, Schrödinger Suite, GROMACS, DeepChem | Protein structure prediction, molecular docking, dynamics simulations, and machine learning model development. | Bridge the gap from target identification to structural analysis and lead optimization [138] [131] [130]. |
| Experimental Reagents (for Validation) | CRISPR-Cas9 kits, RNAi libraries, Recombinant proteins, Activity assay kits (e.g., kinase, protease) | Experimental validation of target essentiality and compound efficacy in cellular and biochemical assays. | Wet-lab tools are critical for confirming computational predictions [131] [130]. |
| FAIR & Provenance Tools | RO-Crate, WorkflowHub, Docker/Singularity, Git | Package workflows with metadata, ensure reproducibility, and containerize software environments. | Fundamental for sharing, publishing, and reusing compliant research objects [137]. |
Conclusion
Molecular docking has evolved from a supplementary tool to a central component of computer-aided drug discovery, significantly accelerated by integration with artificial intelligence and machine learning. The development of dynamic docking approaches that account for protein flexibility, combined with more robust scoring functions and validation frameworks, addresses longstanding limitations in predicting binding affinities and poses. As AI-driven models like DynamicBind demonstrate remarkable capabilities in sampling biologically relevant conformational states and identifying cryptic pockets, the field moves toward more accurate prediction of complex protein-ligand interactions. Future directions will focus on improving model interpretability, integrating diverse biological data types, and establishing clearer regulatory pathways for AI-predicted drug candidates. The continued convergence of computational predictions with experimental validation through techniques like CETSA and molecular dynamics simulations will further enhance translational success, ultimately accelerating the development of novel therapeutics for previously undruggable targets.
References
- 1. Key Topics in Molecular Docking for Drug Design - PMC [https://pmc.ncbi.nlm.nih.gov/articles/PMC6769580/]
- 2. Molecular Docking and Structure-Based Drug Design ... [https://pmc.ncbi.nlm.nih.gov/articles/PMC6332083/]
- 3. Navigating structure-based drug discovery with emerging ... [https://www.nature.com/articles/s44386-025-00031-4]
- 4. Molecular docking as a tool for the discovery ... [https://www.nature.com/articles/s41598-023-40160-2]
- 5. Enrichment Studies for a Diverse Set of Pharmaceutically ... [https://pmc.ncbi.nlm.nih.gov/articles/PMC2547888/]
- 6. CoDock-Ligand: combined template-based docking and CNN ... [https://bmcbioinformatics.biomedcentral.com/articles/10.1186/s12859-023-05571-y]
- 7. Network Pharmacology and Molecular Docking Study on the ... [https://pmc.ncbi.nlm.nih.gov/articles/PMC11687011/]
- 8. Network pharmacology and molecular docking reveal the ... [https://pmc.ncbi.nlm.nih.gov/articles/PMC10316186/]
- 9. Docking strategies for predicting protein-ligand interactions ... [https://pmc.ncbi.nlm.nih.gov/articles/PMC11583305/]
- 10. A practical guide to large-scale docking [https://www.nature.com/articles/s41596-021-00597-z]
- 11. Dynamic Docking: A Paradigm Shift in Computational Drug ... [https://pmc.ncbi.nlm.nih.gov/articles/PMC6150405/]
- 12. Beyond rigid docking: deep learning approaches for fully ... [https://pmc.ncbi.nlm.nih.gov/articles/PMC12406700/]
- 13. Developing Generalizable Scoring Functions for Molecular ... [https://www.sciencedirect.com/science/article/pii/S0929867325002418]
- 14. Pairwise Performance Comparison of Docking Scoring ... [https://www.mdpi.com/1420-3049/30/13/2777]
- 15. Ten quick tips to perform meaningful and reproducible ... [https://pmc.ncbi.nlm.nih.gov/articles/PMC12064015/]
- 16. Decoding the limits of deep learning in molecular docking for ... [https://pubs.rsc.org/en/content/articlehtml/2025/sc/d5sc05395a]
- 17. DigFrag as a digital fragmentation method used for artificial ... [https://www.nature.com/articles/s42004-024-01346-5]
- 18. Ensemble Docking in Drug Discovery [https://www.sciencedirect.com/science/article/pii/S0006349518303242]
- 19. Molecular fragmentation as a crucial step in the AI-based ... [https://pmc.ncbi.nlm.nih.gov/articles/PMC10834946/]
- 20. Fragment-based drug discovery: A graphical review [https://www.sciencedirect.com/science/article/pii/S2590257125000215]
- 21. Recent Advances in Molecular Docking Techniques [https://pubmed.ncbi.nlm.nih.gov/40696555/]
- 22. Molecular Docking: A powerful approach for structure-based ... [https://pmc.ncbi.nlm.nih.gov/articles/PMC3151162/]
- 23. A dynamic niching genetic algorithm strategy for docking ... [https://www.sciencedirect.com/science/article/abs/pii/S0020025514007919]
- 24. MCDOCK: a Monte Carlo simulation approach to the molecular docking problem - PubMed [https://pubmed.ncbi.nlm.nih.gov/10483527/]
- 25. The Application of the Combination of Monte Carlo Optimization Method based QSAR Modeling and Molecular Docking in Drug Design and Development - PubMed [https://pubmed.ncbi.nlm.nih.gov/32048970/]
- 26. Molecular Docking - An easy protocol [https://www.protocols.io/view/molecular-docking-an-easy-protocol-m2dc8a6]
- 27. Assessing Genetic Algorithm-Based Docking Protocols for ... [https://pmc.ncbi.nlm.nih.gov/articles/PMC10669598/]
- 28. Open protocols for docking and MD-based scoring of ... [https://www.sciencedirect.com/science/article/pii/S2667318522000149]
- 29. 13.1: Reading - Chemistry LibreTexts [https://chem.libretexts.org/Courses/Fordham_University/Chem1102%3A_Drug_Discovery_-_From_the_Laboratory_to_the_Clinic/13%3A_Computer-Aided_Drug_Design/13.01%3A__Reading]
- 30. Past, Present, and Future Perspectives on Computer - Aided ... Drug [https://pmc.ncbi.nlm.nih.gov/articles/PMC10180087/]
- 31. Empirical Scoring Functions for Structure-Based Virtual ... [https://pmc.ncbi.nlm.nih.gov/articles/PMC6165880/]
- 32. Scoring functions for docking [https://en.wikipedia.org/wiki/Scoring_functions_for_docking]
- 33. A comprehensive survey of scoring functions for protein ... [https://bmcbioinformatics.biomedcentral.com/articles/10.1186/s12859-024-05991-4]
- 34. Docking and scoring - Schrödinger [https://www.schrodinger.com/life-science/learn/white-papers/docking-and-scoring/]
- 35. Knowledge-based scoring function to predict protein-ligand ... [https://www.sciencedirect.com/science/article/pii/S0022283699933715]
- 36. A knowledge-based scoring function for protein-ligand ... [https://link.springer.com/chapter/10.1007/0-306-46883-2_7]
- 37. A Hydrophobic‐Interaction‐Based Mechanism Triggers ... [https://pmc.ncbi.nlm.nih.gov/articles/PMC7646041/]
- 38. Molecular docking approach on the binding stability of ... [https://www.sciencedirect.com/science/article/pii/S2666934X23000235]
- 39. Steric parameters, molecular modeling and hydropathic ... [https://pmc.ncbi.nlm.nih.gov/articles/PMC4403088/]
- 40. Quantitative structure‐activity relationship and molecular ... [https://pmc.ncbi.nlm.nih.gov/articles/PMC7167072/]
- 41. Buried Hydrogen Bond Interactions Contribute to the High ... [https://pmc.ncbi.nlm.nih.gov/articles/PMC5151139/]
- 42. Benchmarking different docking protocols for predicting the ... [https://pmc.ncbi.nlm.nih.gov/articles/PMC10945300/]
- 43. A Comprehensive Review on the Top 10 Molecular ... [https://parssilico.com/blogs/86-top-10-molecular-docking-softwares]
- 44. AutoDock Vina: improving the speed and accuracy of ... [https://pmc.ncbi.nlm.nih.gov/articles/PMC3041641/]
- 45. FeatureDock for protein-ligand docking guided by ... [https://www.nature.com/articles/s44386-025-00005-6]
- 46. AutoDock Vina Manual [https://vina.scripps.edu/manual/]
- 47. Calculating an optimal box size for ligand docking and virtual ... [https://jcheminf.biomedcentral.com/articles/10.1186/s13321-015-0067-5]
- 48. An accurate and universal protein-small molecule batch ... [https://www.sciencedirect.com/science/article/pii/S2590123023004620]
- 49. Emerging structure-based computational methods to ... [https://www.sciencedirect.com/science/article/pii/S0959440X24000393]
- 50. Computer-Aided Drug Design and Drug Discovery - PMC [https://pmc.ncbi.nlm.nih.gov/articles/PMC11946204/]
- 51. Convergence of Computer-Aided Drug Discovery and ... [https://www.sciencedirect.com/science/article/pii/S2773216925000388]
- 52. DynamicBind: predicting ligand-specific protein ... [https://www.nature.com/articles/s41467-024-45461-2]
- 53. Basic docking — Autodock Vina 1.2.0 documentation [https://autodock-vina.readthedocs.io/en/latest/docking_basic.html]
- 54. proteins - PDBQT file format [https://bioinformatics.stackexchange.com/questions/18340/pdbqt-file-format]
- 55. A Guide to Molecular Standardization | Depth-First [https://depth-first.com/articles/2020/07/27/a-guide-to-molecular-standardization/]
- 56. PubChem chemical structure standardization - PMC [https://pmc.ncbi.nlm.nih.gov/articles/PMC6086778/]
- 57. Advancing QSAR models in drug discovery for best ... [https://www.sciencedirect.com/science/article/abs/pii/S0169743925002291]
- 58. A simple click by click protocol to perform docking [https://pmc.ncbi.nlm.nih.gov/articles/PMC4669947/]
- 59. AutoDock PDBQT format (pdbqt) - Open Babel - Read the Docs [https://open-babel.readthedocs.io/en/latest/FileFormats/AutoDock_PDBQT_format.html]
- 60. Good Practices in Model‐Informed Drug Discovery and ... [https://pmc.ncbi.nlm.nih.gov/articles/PMC4809625/]
- 61. High-throughput and virtual screening: core lead discovery ... [https://www.sciencedirect.com/science/article/pii/S1359644600800562]
- 62. Computational-aided drug design strategies for drug ... [https://pmc.ncbi.nlm.nih.gov/articles/PMC12634332/]
- 63. Computational-aided drug design strategies for ... [https://www.frontiersin.org/journals/pharmacology/articles/10.3389/fphar.2025.1678652/full]
- 64. ChemDoodle | Chemical Drawing Software [https://www.chemdoodle.com/]
- 65. Computer-Aided Drug-Discovery Techniques that Account ... [https://pmc.ncbi.nlm.nih.gov/articles/PMC3026641/]
- 66. Protein Flexibility in Docking and Surface Mapping - PMC [https://pmc.ncbi.nlm.nih.gov/articles/PMC4272345/]
- 67. Computer-aided drug-discovery techniques that account ... [https://www.sciencedirect.com/science/article/abs/pii/S1471489210001372]
- 68. Approaches to solving the rigid receptor problem by ... [https://www.sciencedirect.com/science/article/pii/S1074552101000230]
- 69. A method for including protein flexibility in protein-ligand ... [https://www.sciencedirect.com/science/article/abs/pii/S109332630000036X]
- 70. Treatment of flexibility of protein backbone in simulations ... [https://www.nature.com/articles/s41598-024-59899-3]
- 71. Data driven flexible backbone protein design [https://journals.plos.org/ploscompbiol/article?id=10.1371/journal.pcbi.1005722]
- 72. Flexible docking — Autodock Vina 1.2.0 documentation [https://autodock-vina.readthedocs.io/en/latest/docking_flexible.html]
- 73. Computer-Aided Drug Design and Drug Discovery [https://pmc.ncbi.nlm.nih.gov/articles/PMC10819513/]
- 74. Computational approaches streamlining drug discovery [https://www.nature.com/articles/s41586-023-05905-z]
- 75. In silico evaluation of 4-quinolone ligands interacting with ... [https://jmhg.springeropen.com/articles/10.1186/s43042-025-00780-x]
- 76. G protein-coupled receptors (GPCRs): advances in ... [https://www.nature.com/articles/s41392-024-01803-6]
- 77. Molecular docking studies of gyrase inhibitors [https://pmc.ncbi.nlm.nih.gov/articles/PMC7775855/]
- 78. 2025 Computer Aided Drug Design Conference GRC [https://www.grc.org/computer-aided-drug-design-conference/2025/]
- 79. Vanderbilt scientist tackles key roadblock for AI in drug discovery [https://medschool.vanderbilt.edu/basic-sciences/2025/10/16/vanderbilt-scientist-tackles-key-roadblock-for-ai-in-drug-discovery/]
- 80. Grand Challenges of Computer-Aided Drug Design [https://www.frontiersin.org/journals/drug-discovery/articles/10.3389/fddsv.2021.728551/full]
- 81. New machine learning and physics-based scoring functions for drug discovery | Scientific Reports [https://www.nature.com/articles/s41598-021-82410-1]
- 82. Correcting the impact of docking pose generation error on ... [https://bmcbioinformatics.biomedcentral.com/articles/10.1186/s12859-016-1169-4]
- 83. Machine Learning Scoring Functions for Drug Discovery ... [https://pmc.ncbi.nlm.nih.gov/articles/PMC9966217/]
- 84. Exploring Protein–Ligand Binding-Affinity Prediction | Rowan [https://rowansci.com/blog/exploring-protein-ligand-binding-affinity-prediction]
- 85. Incorporating Target Protein Structure Flexibility and ... [https://pubmed.ncbi.nlm.nih.gov/40622888/]
- 86. Tutorial EDES / HADDOCK for ligand-protein docking [https://www.bonvinlab.org/education/biomolecular-simulations-2019/Metadynamics_tutorial/]
- 87. HADDOCK Web Server [https://rascar.science.uu.nl/haddock2.4/]
- 88. LABind: identifying protein binding ligand-aware sites via ... [https://www.nature.com/articles/s41467-025-62899-0]
- 89. A Blind Spot in Drug Discovery: Pocket Finding [https://deeporigin.com/blog/a-blind-spot-in-drug-discovery-pocket-finding]
- 90. A novel prediction method for protein-DNA binding sites ... [https://bmcgenomics.biomedcentral.com/articles/10.1186/s12864-025-12196-3]
- 91. Protein Pockets: Inventory, Shape, and Comparison - PMC [https://pmc.ncbi.nlm.nih.gov/articles/PMC2859996/]
- 92. Group Ligands Docking to Protein Pockets [https://arxiv.org/html/2501.15055v1]
- 93. Protocols Utilizing Constant pH Molecular Dynamics to ... [https://pmc.ncbi.nlm.nih.gov/articles/PMC4306499/]
- 94. Exploring the limits of the generalized CHARMM and ... [https://pmc.ncbi.nlm.nih.gov/articles/PMC11275216/]
- 95. Protein Preparation Workflow - Schrödinger [https://www.schrodinger.com/life-science/learn/white-papers/protein-preparation-workflow/]
- 96. Changes in Protonation States of In-Pathway Residues can ... [https://pmc.ncbi.nlm.nih.gov/articles/PMC9289141/]
- 97. Constant pH molecular dynamics simulations [https://www.sciencedirect.com/science/article/abs/pii/S0959440X22001774]
- 98. Comprehensive Survey of Consensus Docking for High ... [https://pmc.ncbi.nlm.nih.gov/articles/PMC9821981/]
- 99. Exponential consensus ranking improves the outcome in ... [https://www.nature.com/articles/s41598-019-41594-3]
- 100. Incorporating Protein Dynamics Through Ensemble ... [https://pmc.ncbi.nlm.nih.gov/articles/PMC5961778/]
- 101. dockECR: Open consensus docking and ranking protocol ... [https://www.sciencedirect.com/science/article/abs/pii/S1093326321001947]
- 102. Molecular docking and dynamics in protein serine/threonine ... [https://pmc.ncbi.nlm.nih.gov/articles/PMC12598042/]
- 103. Structure-Based Virtual Screening: From Classical to ... [https://pmc.ncbi.nlm.nih.gov/articles/PMC7200080/]
- 104. An artificial intelligence accelerated virtual screening ... [https://www.nature.com/articles/s41467-024-52061-7]
- 105. Computational Methods in Drug Discovery - PMC [https://pmc.ncbi.nlm.nih.gov/articles/PMC3880464/]
- 106. 2.3. Data Sets and Benchmarks in Virtual Screening [https://bio-protocol.org/exchange/minidetail?id=9605214&type=30]
- 107. - Large Identifies Novel Allosteric Modulators... Scale Virtual Screening [https://chemrxiv.org/engage/chemrxiv/article-details/691bc4d0ef936fb4a217a025]
- 108. Activity prediction benchmarking [https://www.desertsci.com/2025/06/27/activity-prediction-benchmarking/]
- 109. Benchmarking the Structure-Based Virtual Screening ... [https://pmc.ncbi.nlm.nih.gov/articles/PMC12363558/]
- 110. Benchmarking compound activity prediction for real-world ... [https://www.nature.com/articles/s42004-024-01204-4]
- 111. Molecular docking-based computational platform for high- ... [https://pmc.ncbi.nlm.nih.gov/articles/PMC8754542/]
- 112. Protein Target Prediction and Validation of Small Molecule ... [https://www.jove.com/t/66564/protein-target-prediction-and-validation-of-small-molecule-compound]
- 113. Screening for Target Engagement using the Cellular Thermal ... [https://www.ncbi.nlm.nih.gov/books/NBK374282/]
- 114. Applications of the Cellular Thermal Shift Assay to Drug ... [https://pmc.ncbi.nlm.nih.gov/articles/PMC12072176/]
- 115. Application of the Cellular Thermal Shift Assay (CETSA) to ... [https://www.repository.cam.ac.uk/items/f300220e-5655-4dfb-8afe-1bc7fb4915e6]
- 116. CETSA Selectivity Profiling: Powerful Drug Discovery Insights [https://www.pelagobio.com/cetsa-drug-discovery-resources/blog/cetsa-selectivity-profiling/]
- 117. Post-Docking Refinement of Peptide or Protein-RNA Complexes Using... [https://pmc.ncbi.nlm.nih.gov/articles/PMC11815843/]
- 118. Benchmarking of Structure Refinement Methods for Protein ... [https://pmc.ncbi.nlm.nih.gov/articles/PMC8671191/]
- 119. SILCS-MC: Docking and Pose Refinement [https://docs.silcsbio.com/2022.2/silcs/silcs-mc-docking.html]
- 120. with MDRefine Refining Molecular Dynamics Simulations [https://scisimple.com/en/articles/2025-05-23-refining-molecular-dynamics-simulations-with-mdrefine--a3jer8v]
- 121. Enriching stabilizing mutations through automated analysis ... [https://pubmed.ncbi.nlm.nih.gov/41074875/]
- 122. Comparison of software for molecular mechanics modeling [https://en.wikipedia.org/wiki/Comparison_of_software_for_molecular_mechanics_modeling]
- 123. Modeling and Simulation Software [https://www.rcsb.org/docs/additional-resources/modeling-and-simulation-software]
- 124. Docking calculations and pose refinement with molecular ... [https://bio-protocol.org/exchange/minidetail?id=7072317&type=30]
- 125. Computational advances in discovering cryptic pockets for ... [https://www.sciencedirect.com/science/article/pii/S0959440X24002021]
- 126. Comparative study of innovative computational methods for ... [https://www.sciencedirect.com/science/article/abs/pii/S1359644625001436]
- 127. Evaluating ligand docking methods for drugging protein ... [https://pmc.ncbi.nlm.nih.gov/articles/PMC12465486/]
- 128. Predicting locations of cryptic pockets from single protein ... [https://www.nature.com/articles/s41467-023-36699-3]
- 129. Structure prediction of protein-ligand complexes from ... [https://www.nature.com/articles/s41467-024-48837-6]
- 130. Artificial intelligence for drug target identification [https://www.sciencedirect.com/science/article/pii/S0065774325000028]
- 131. opportunities for innovation in drug discovery - PubMed Central [https://pmc.ncbi.nlm.nih.gov/articles/PMC12641420/]
- 132. Breakthroughs in AI and multi-omics for cancer drug ... [https://www.sciencedirect.com/science/article/abs/pii/S0223523424008067]
- 133. The Power of High-Throughput Omics Integration - PMC [https://pmc.ncbi.nlm.nih.gov/articles/PMC11417901/]
- 134. Making Data Work: How AI and Multi-Omics Integration Are ... [https://ai.northeastern.edu/news/making-data-work]
- 135. High Throughput Multi-Omics Approaches for Clinical Trial ... [https://www.frontiersin.org/journals/immunology/articles/10.3389/fimmu.2021.590742/full]
- 136. Computational and systematic analysis of multi-omics data ... [https://pmc.ncbi.nlm.nih.gov/articles/PMC9989304/]
- 137. A multi-omics data analysis workflow packaged as a FAIR ... [https://pmc.ncbi.nlm.nih.gov/articles/PMC10787363/]
- 138. Pharmacophore modelling based virtual screening and ... [https://www.nature.com/articles/s41598-024-63555-1]
- 139. Unlocking the Power of Multi-Omics Biology through Data ... [https://www.parsebiosciences.com/jp/blog/unlocking-the-power-of-multi-omics-biology-through-data-science/]